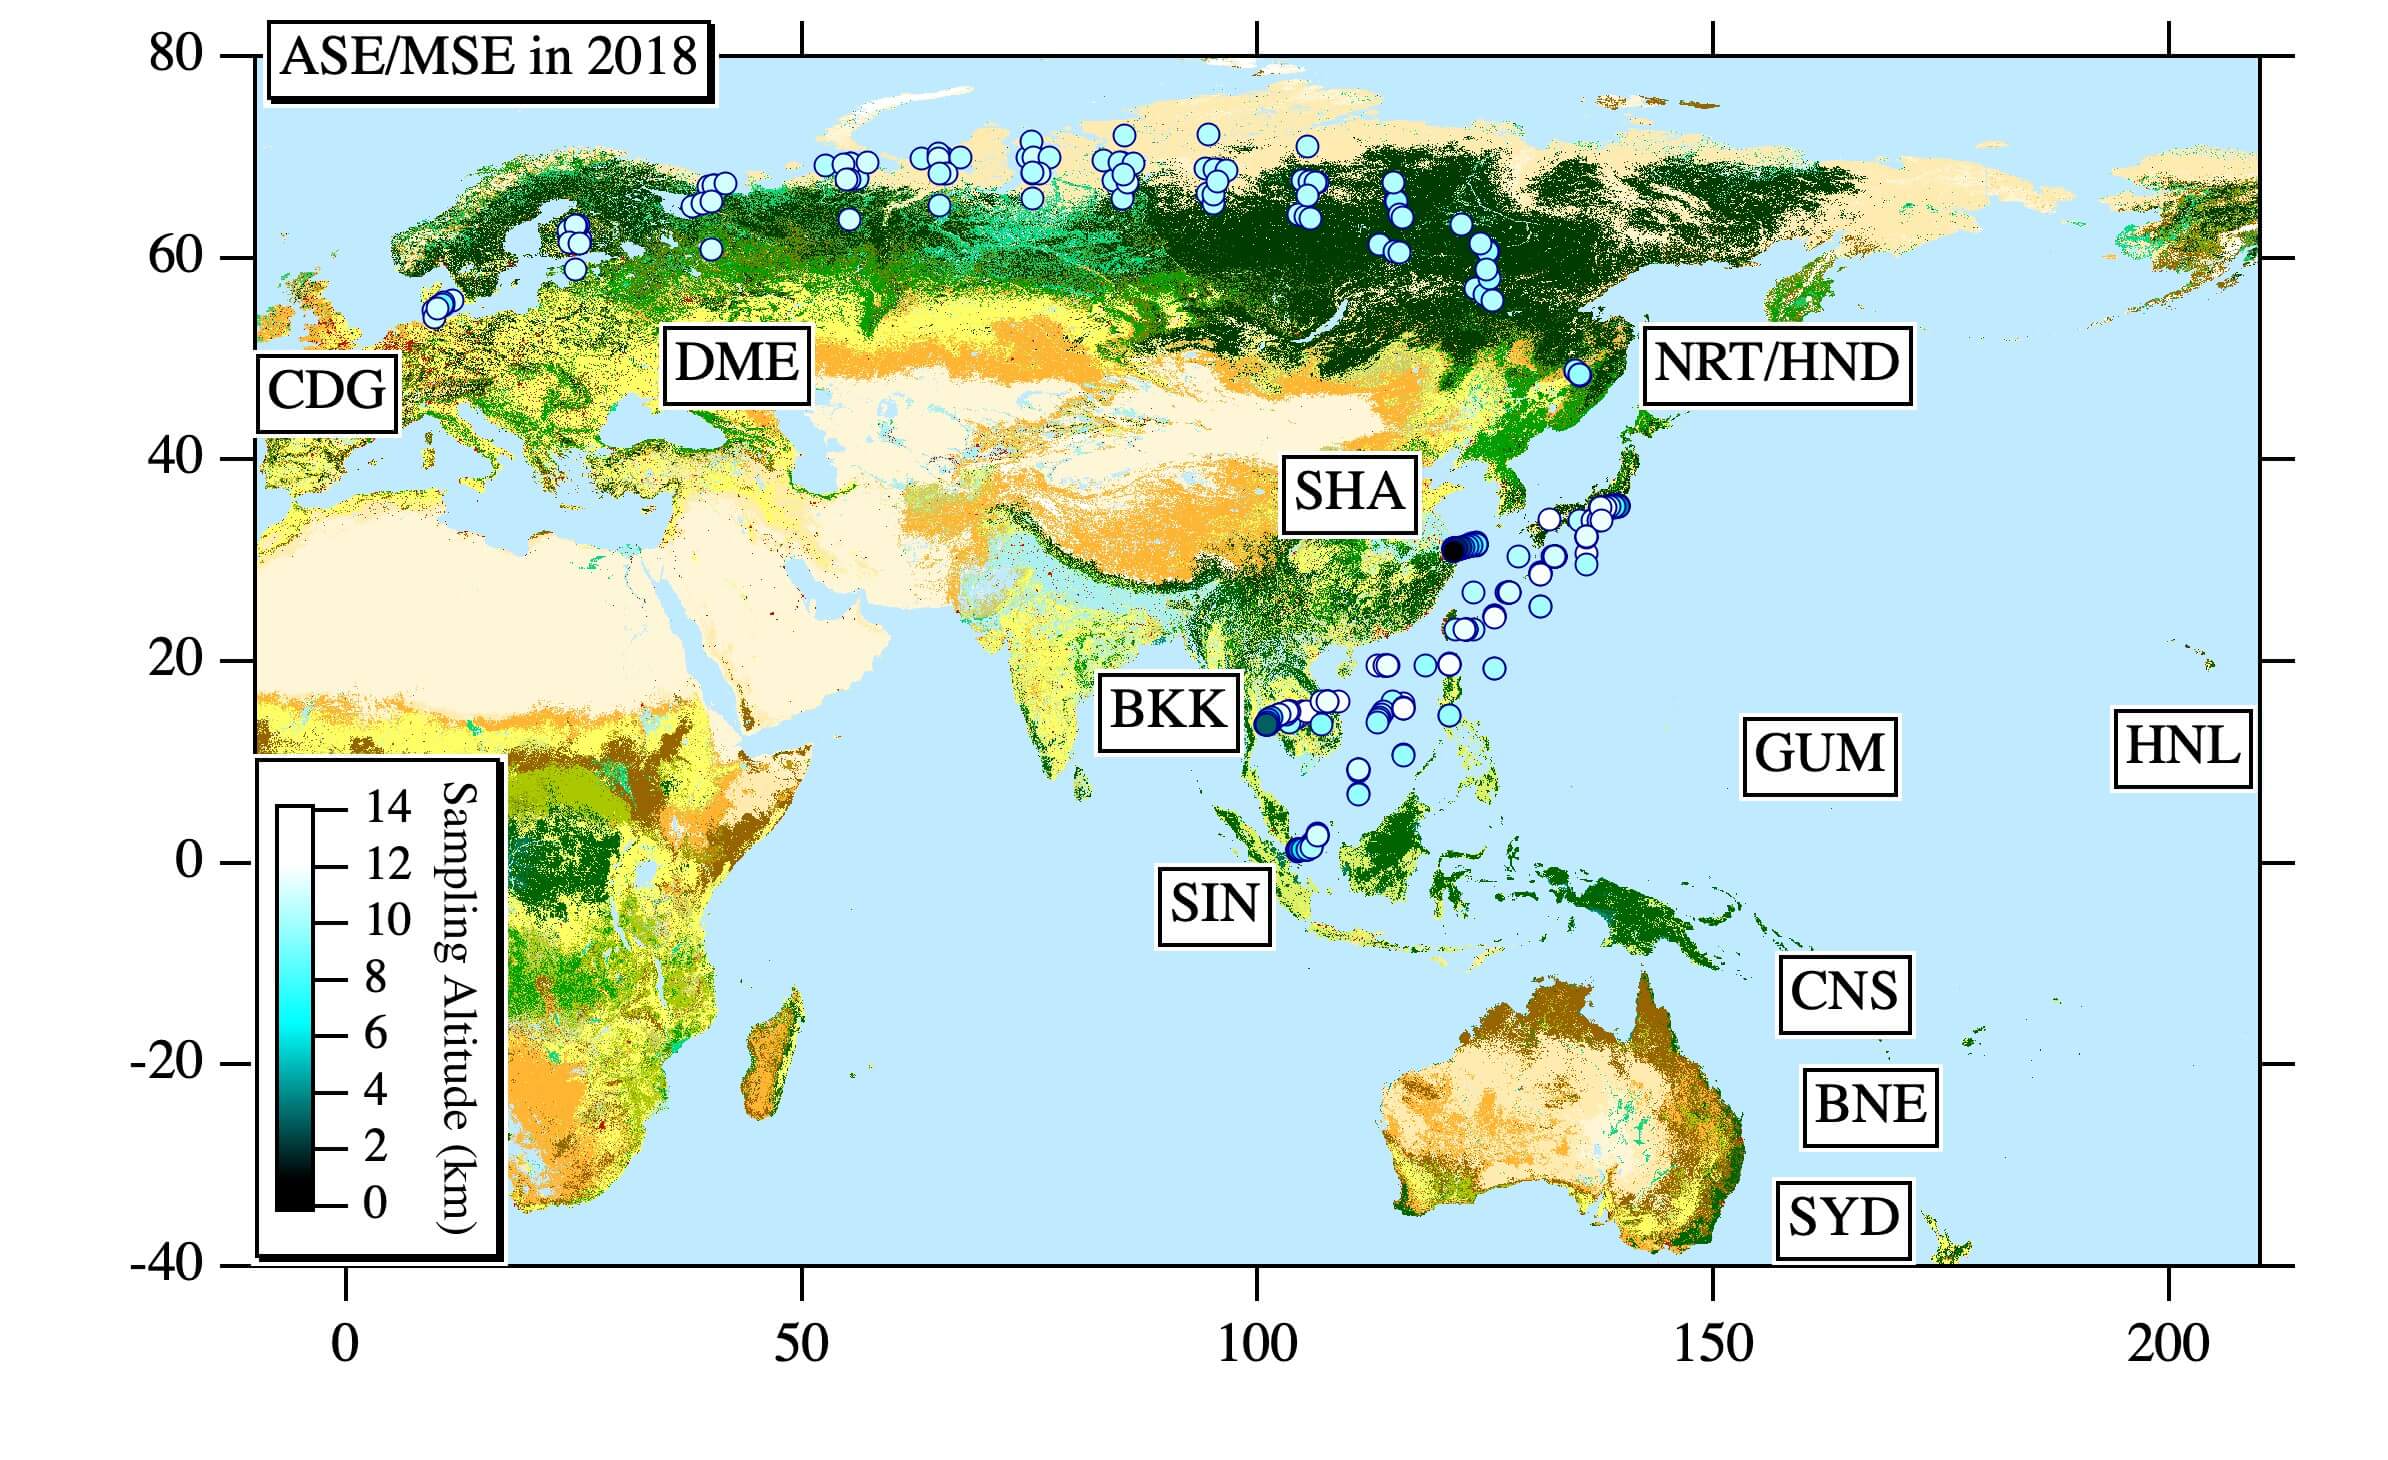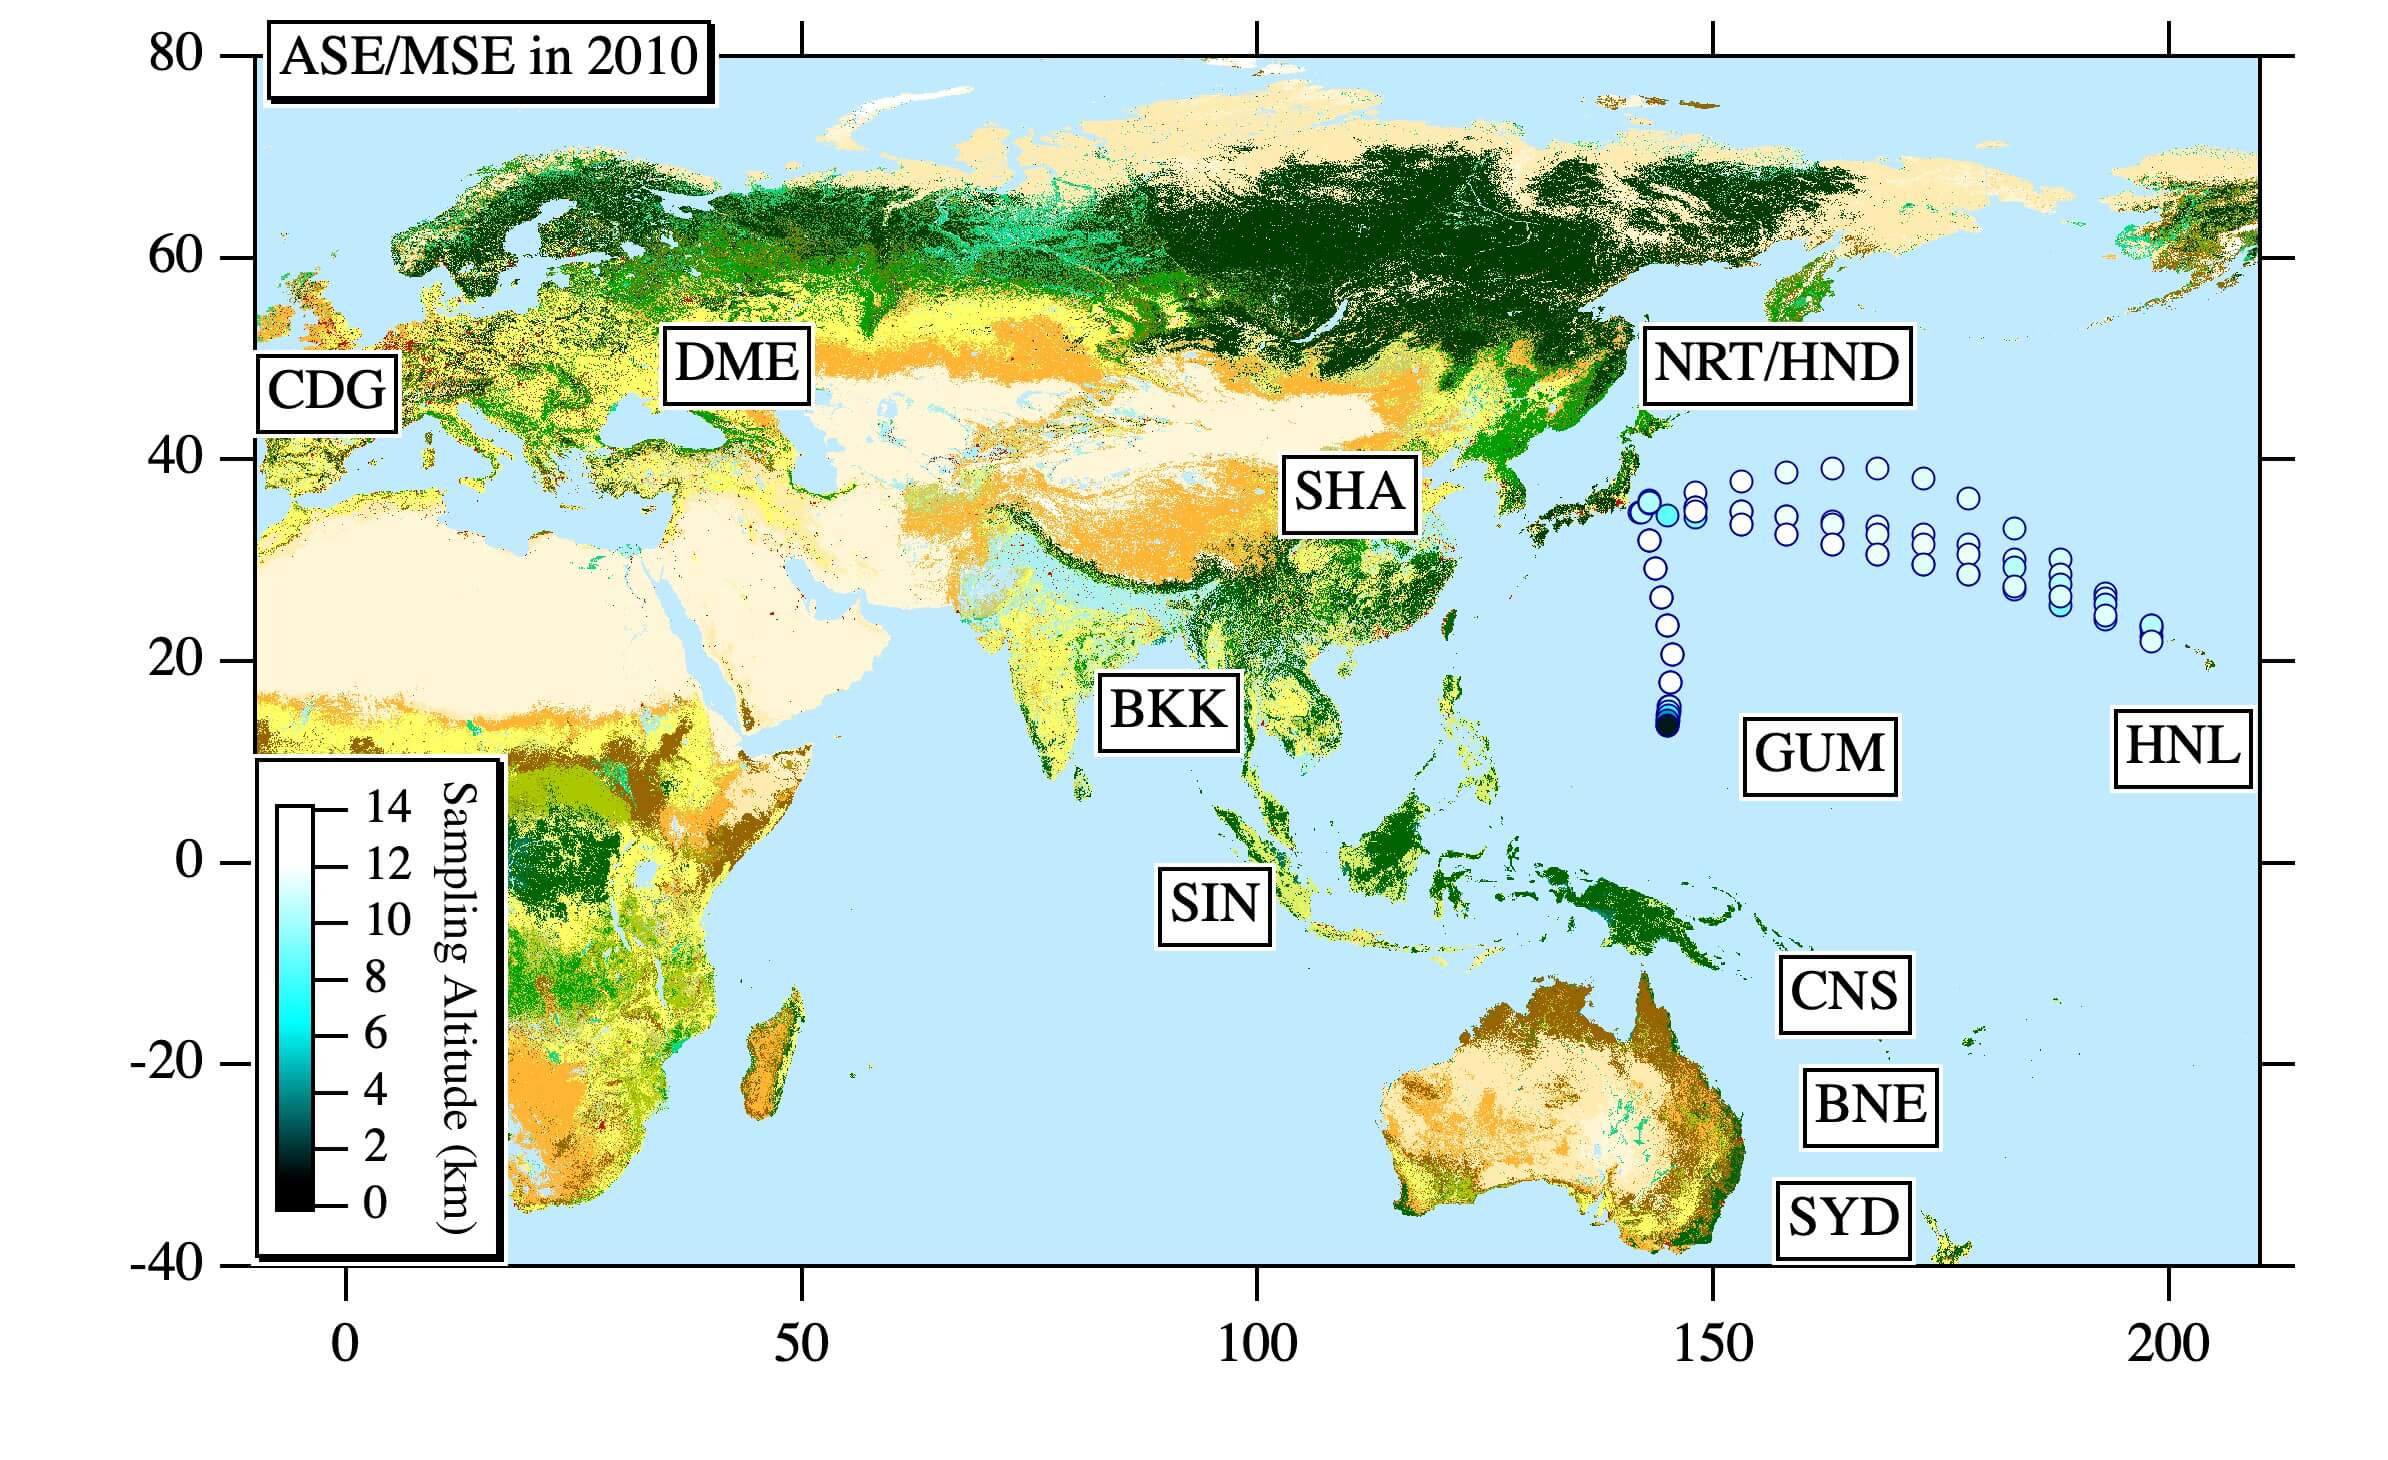
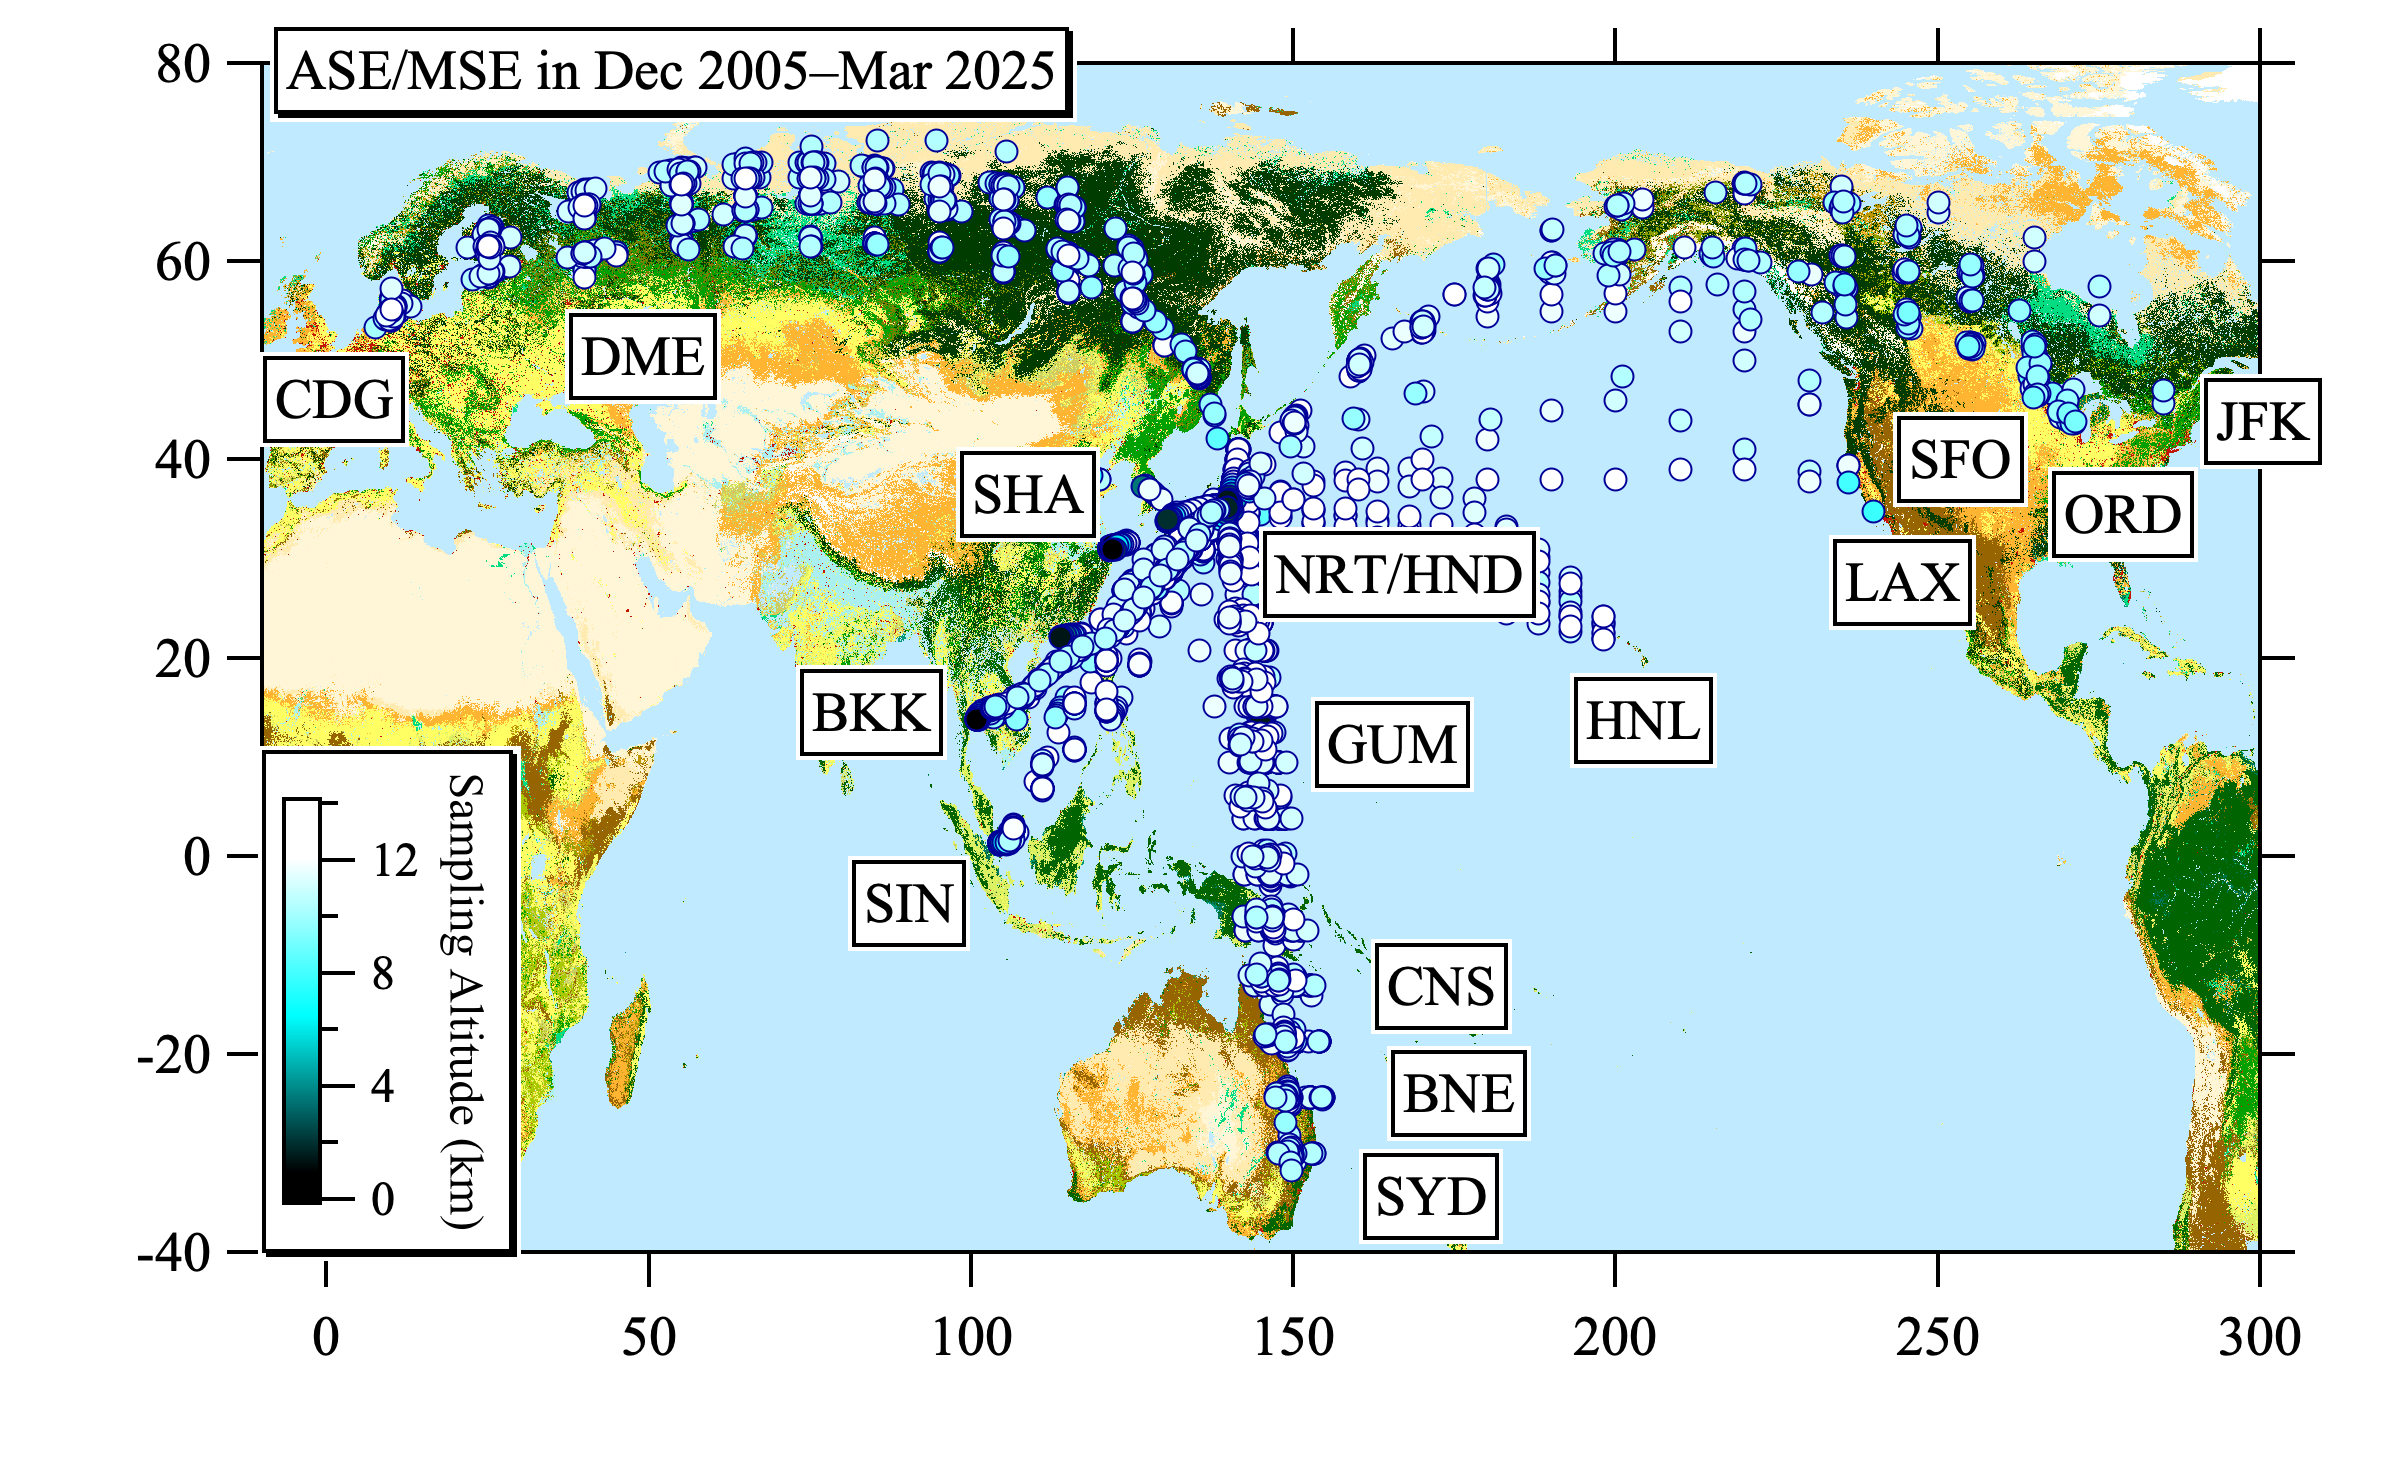
Locations and Statistics of Air Samples (as of Mar 2025)
| Number of Sampling Flights | |
|---|---|
| ASE | 397 |
| MSE | 128 |
| Total | 525 |
| Number of Air Samples | |
| ASE | 4608 |
| MSE | 1820 |
| Total | 6428 |
PageTop
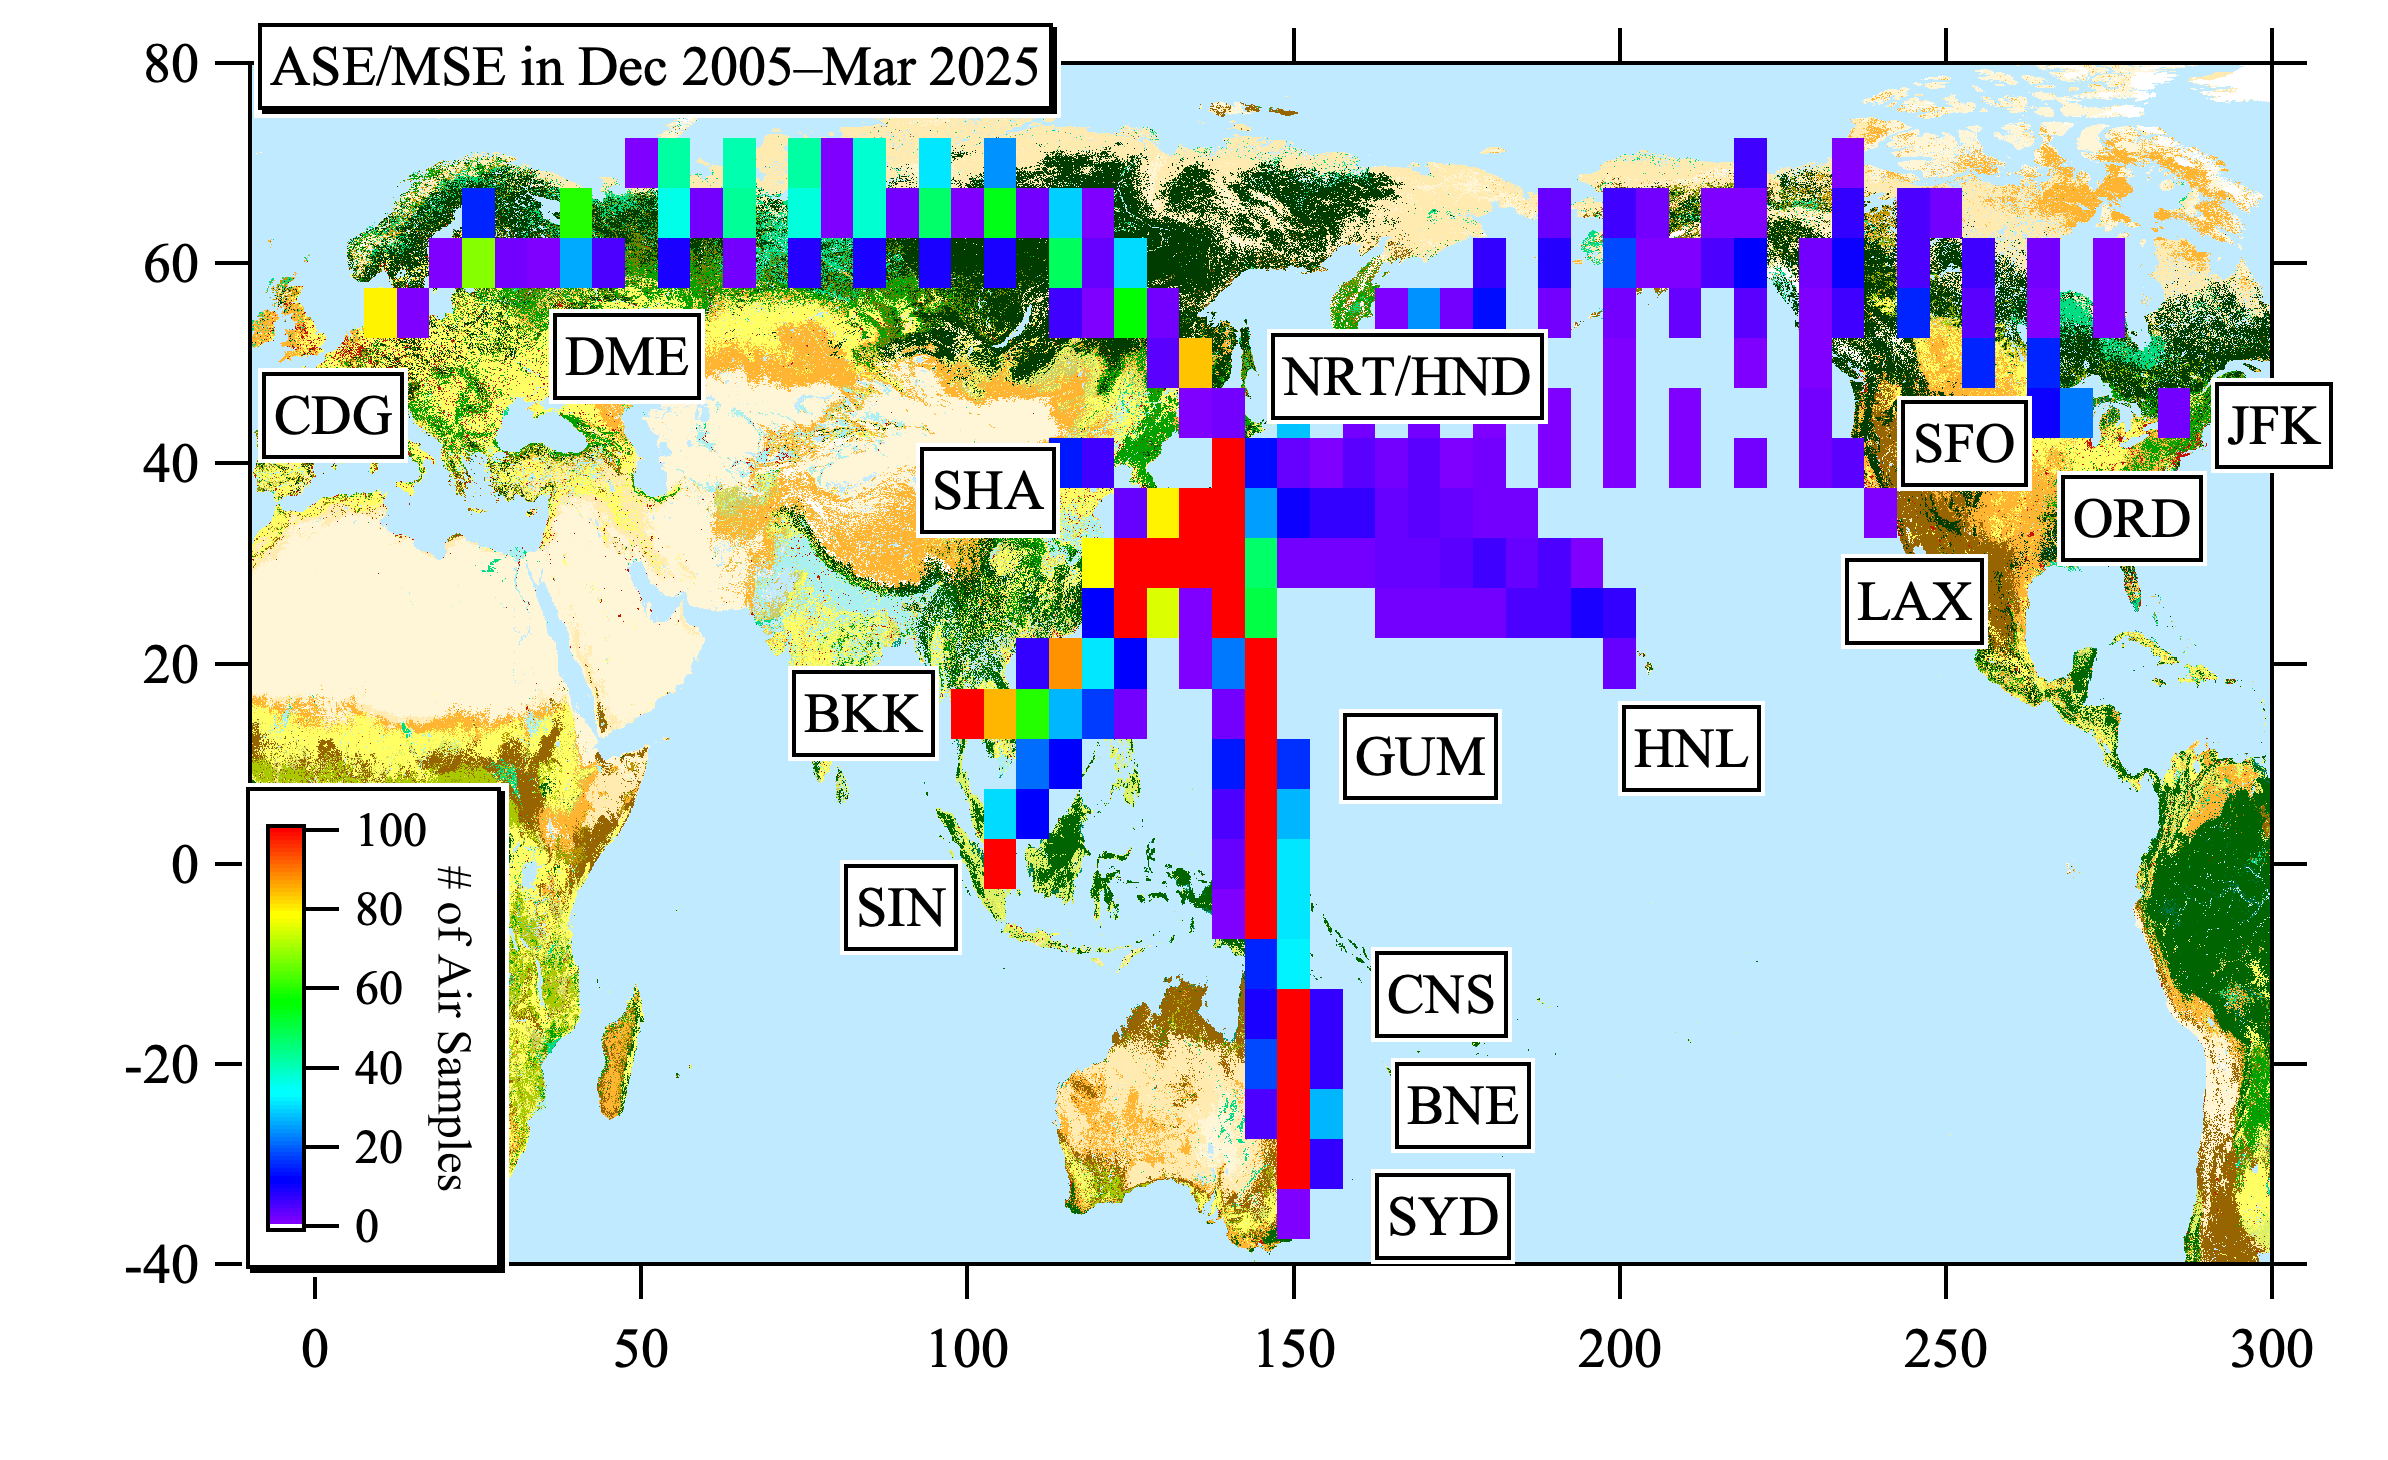
Number of Air Samples in 5° bins (as of Mar 2025)
PageTop

| Year | Date | From/To | Aircraft |
|---|---|---|---|
| 2025 | 21 Jan | ORD | JA735J |
| 2025 | 30 Jan | SYD | JA732J |
| 2025 | 19 Feb | BKK | JA743J |
| 2025 | 26 Feb | SYD | JA741J |
| 2025 | 26 Feb | ORD | JA733J |
| 2025 | 18 Mar | SYD | JA740J |
| 2025 | 25 Mar | ORD | JA740J |
| 2025 | 26 Mar | BKK | JA737J |
| Number of Sampling Flights (2025) | |
|---|---|
| ASE | 0 |
| MSE | 8 |
| Total | 8 |
| Number of Air Samples (2025) | |
| ASE | 0 |
| MSE | 95 |
| Total | 95 |
PageTop