
ASE & MSE
Overview of ASE
The basic design of the new ASE instrument for flask air sampling is similar to that of the previous ASE used in the first phase of the project (Matsueda and Inoue, 1996), but all the components have been replaced for the new project. One of the most significant advancements in the new ASE is a sampling operation system—automatic control based on the real-time monitoring of the flight navigation data from the ARINC 429 data bus of the aircraft.
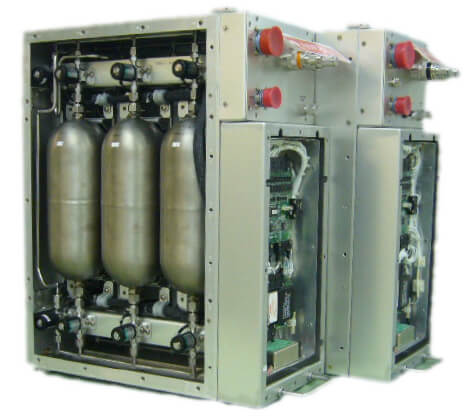
Figure 1 shows a schematic of the new ASE instrument, which consists of two packages (ASE-1 and ASE-2) for easy handling of each package (430 mm length x 215 mm width x 531 mm height); ASE-1 and ASE-2 weigh 17.9 kg and 15.6 kg, respectively. The main components of each ASE package are six flasks, solenoid valves, and pressure sensors (Figure 2), so that 12 air samples in total can be collected during one flight. The cylindrical flasks with an internal volume of about 1.7 L are made of titanium.
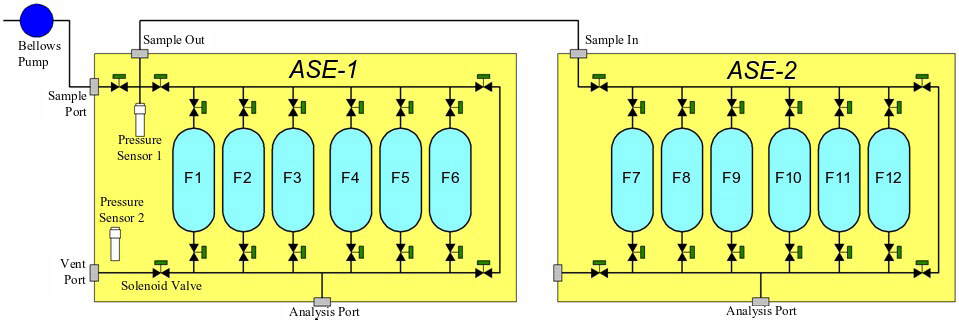
The automated air sampling is performed by a specially designed control board attached to each of the ASE-1 and ASE-2 packages. These boards control the pump and solenoid valves for air sample collection based on inputs from the ARINC 429 data bus on the aircraft and the pressure sensors. Before each flight, sampling operation parameters (e.g. sampling locations, altitudes and air pressure) in the control board are set by a laboratory computer. During the flight, the control board records the ARINC data at 12 air sampling locations, as well as information about the valve and pump operations, so that we can check the sampling procedure after the flight. The new ASE design thus enables us automatic operation without any assistance by crew members onboard the aircraft.
After the flight, the ASE-1 and ASE-2 are unloaded from the aircraft and transported to the National Institute for Environmental Studies (NIES) for high-precision analysis of the mole fractions of CO2, methane (CH4), carbon monoxide (CO), molecular hydrogen (H2), nitrous oxide (N2O), and sulfur hexafluoride (SF6) and stable isotope ratios of CO2 and CH4.
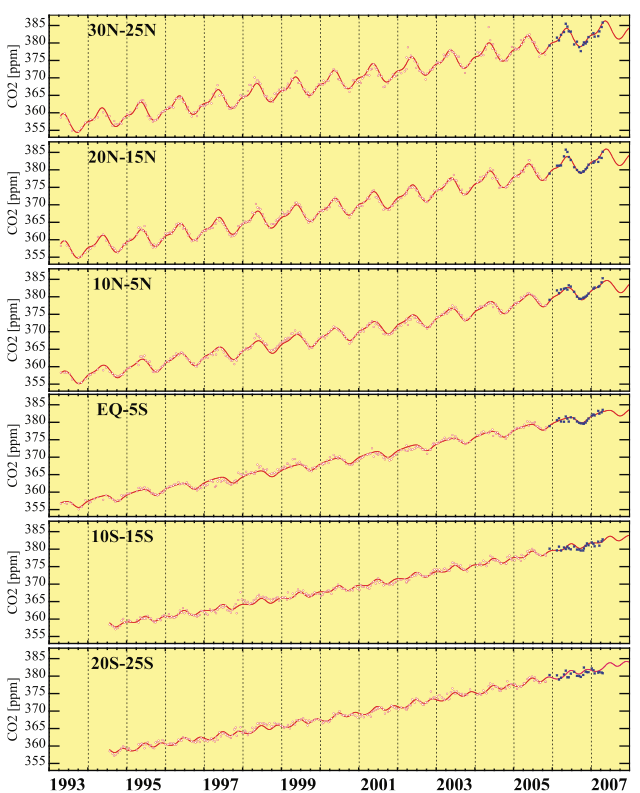
Figure 3 shows CO2 records obtained by ASE over the western Pacific, which provide valuable information on the latitudinal distribution of the atmospheric CO2 seasonal cycle and on the inter-annual variation of long-term increasing trends in the upper troposphere of both Hemispheres (Matsueda et al., 2002; 2008).
References
- Matsueda, H., and H. Y. Inoue (1996), Measurements of atmospheric CO2 and CH4 using a commercial airliner from 1993 to 1994. Atmos. Environ., 30, 1647-1655.
- Matsueda, H., H. Y. Inoue, and M. Ishii (2002), Aircraft observation of carbon dioxide at 8-13 km altitude over the western Pacific from 1993 to 1999, Tellus, Ser. B, 54, 1-21.
- Matsueda, H., T. Machida, Y. Sawa, Y. Nakagawa, K. Hirotani, H. Ikeda, N. Kondo, and K. Goto (2008), Evaluation of atmospheric CO2 measurements from new flask air sampling of JAL airliner observations, Pap. Meteorolo. Geophys., 59, 1-17.
