Tadanobu Nakayama1)
CGER Reports
CGER’S SUPERCOMPUTER MONOGRAPH REPORT Vol.30
This monograph (Part VII, CGER-I169-2024) succeeds a series of previous reports: Vol. 11 (Part I, CGER-I063-2006), Vol. 14 (Part II, CGER-I083-2008), Vol. 18 (Part III, CGER-I103-2012), Vol. 20 (Part IV, CGER-I114-2014), Vol. 26 (Part V, CGER-I148-2019), and Vol. 29 (Part VI, CGER-I167-2023) published before.
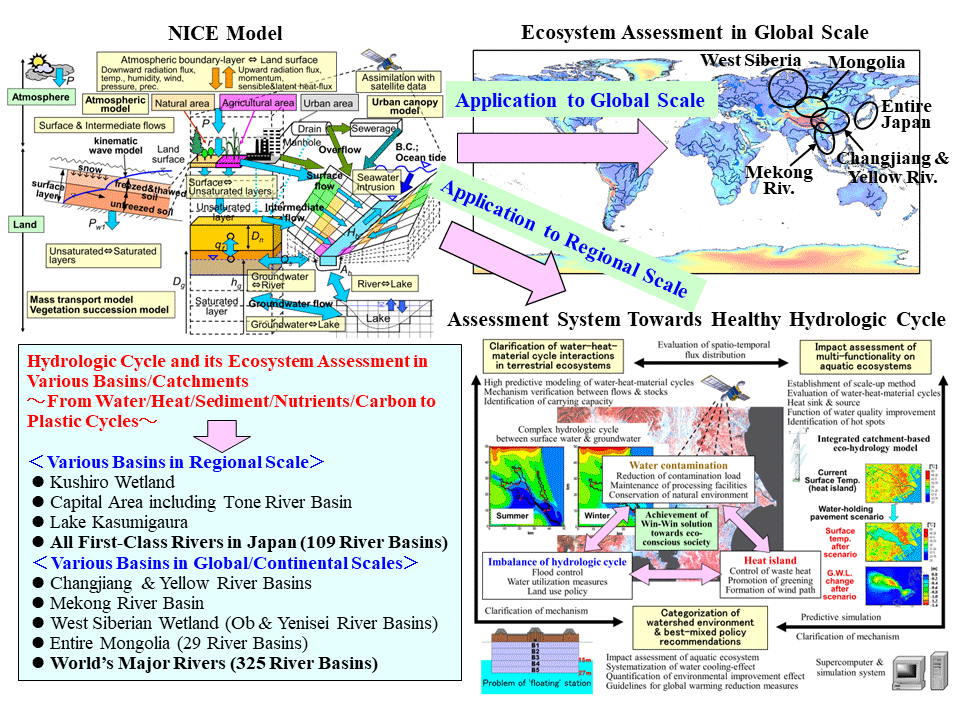
The National Integrated Catchment-based Eco-hydrology (NICE) is a 3-D, grid-based eco-hydrology model that includes complex subsystems of natural vegetation, irrigation, urban water usage, stream junctions, and dams/canals to develop integrated human and natural systems and analyze the impact of anthropogenic activity on eco-hydrological change. In addition to the water cycle, NICE is capable of simulating heat, sediment, nutrients, carbon cycles, and associated vegetation succession. The author has so far conducted simulations using NICE in various basins at regional scale (Kushiro Wetlands, Tokyo metropolitan area, Lake Kasumigaura, and all first-class river basins throughout Japan) to global scale (Yangtze and Yellow Rivers, Mekong River, Siberian Wetlands, Mongolia, and major global river basins) (Fig. 1). The author developed natural-human systems in the model and analyzed the effects of human activities on ecosystem changes in these basins.
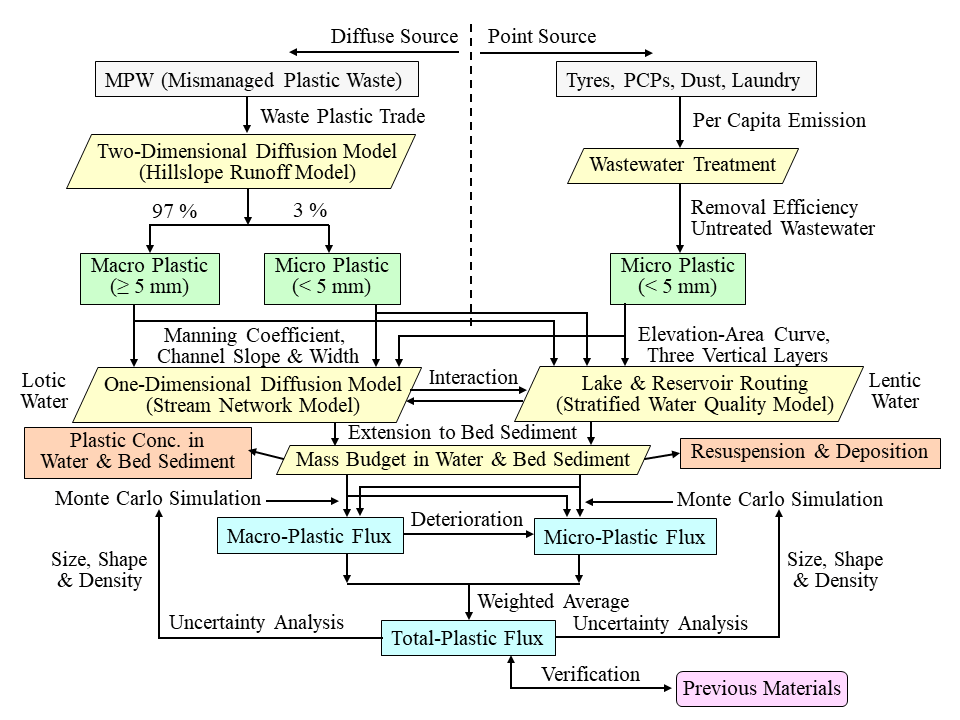
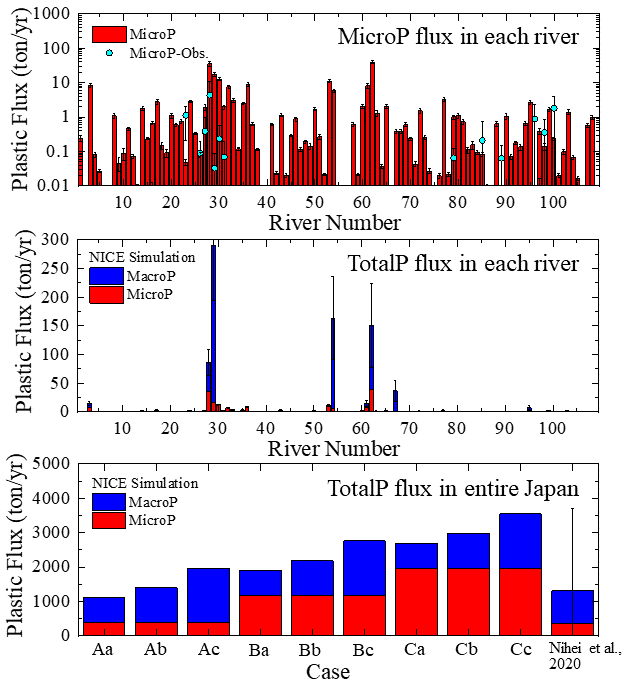
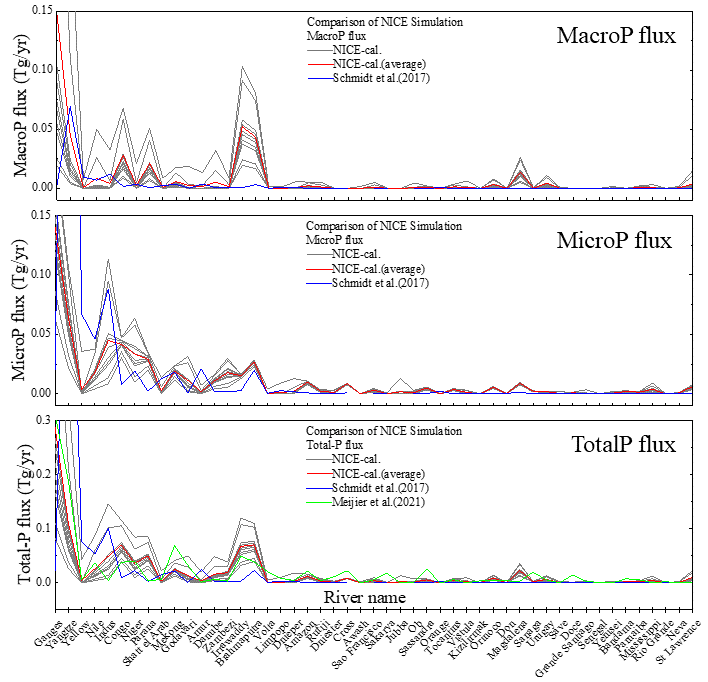
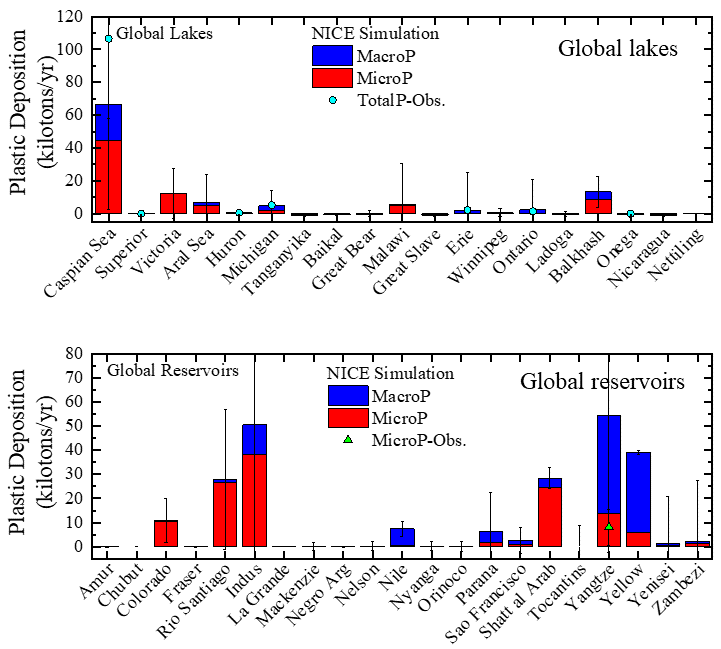
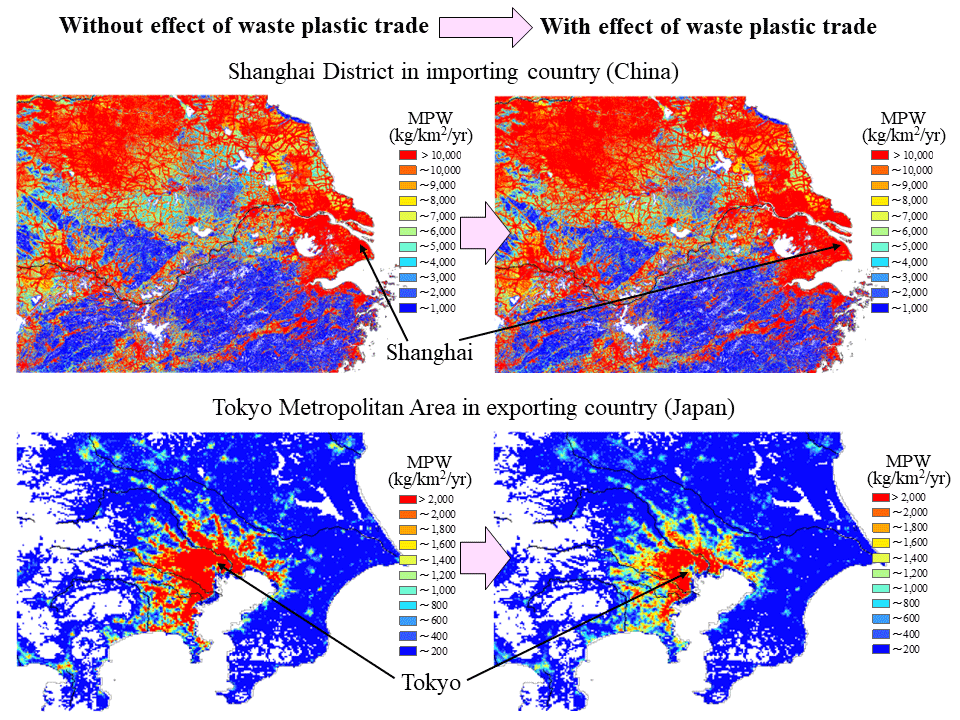
In the current monograph (Part VII), NICE was further extended to couple it with the plastic debris model for quantifying the spatiotemporal dynamics of both macro- and micro-plastics and the impacts of plastic waste on terrestrial and aquatic ecosystems and devising solutions and measures for reduction of plastic input to the ocean (Fig. 2). The author has introduced the results of the quantification of plastic flux to the ocean in all the first-class river basins in the entire Japan (109 river basins) (Fig. 3). Then, the model was extended to apply to the world’s major rivers (325 rivers) of global scale to clarify the effects of various factors such as size, shape, and density on plastic transport by using Monte Carlo model simulations (Fig. 4). In addition, NICE was coupled with LAKE2K in a stratified water quality model to evaluate the global plastic dynamics in both lotic and lentic waters (Fig. 5). Furthermore, the model was extended to include the effect of waste plastic trade flow between Japan and Asian regions to evaluate the impact of the waste plastic trade on changes in riverine plastic transport there (Fig. 6).
This methodology is powerful for detecting and predicting plastic dynamics in river basins and for developing efficient measures to reduce plastic input to the ocean on regional, continental, and global scales. This also helps integrate knowledge and provide the understanding needed to reach sustainability by 2030 in the UN Sustainable Development Goals, which support climate action, clean water, sustainable cities, life below water, and life on land.


 PDF, 3.9 MB