Project 2Climate change and global risk assessment
Results of FY 2013
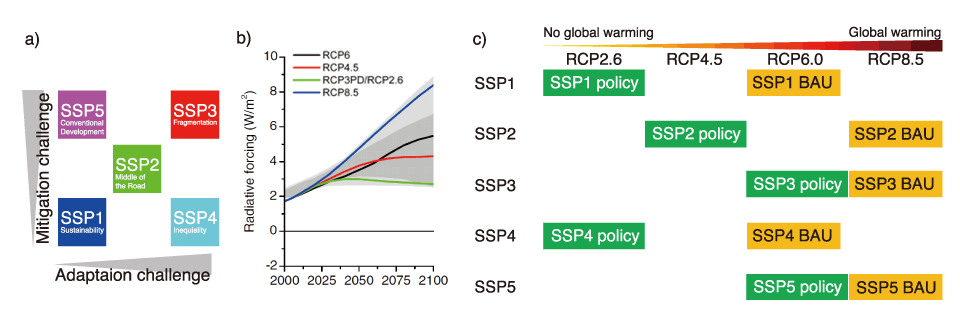
Water is an indispensable resource for humans and the society. Using the latest radiative forcing scenarios (future climate projections) and socio-economic scenarios which were developed through cooperative efforts of the international research community, we conducted detailed simulations of five possible developmental directions (world views) and examined water availability and use in the 21st century (Figure 1). The projected water availability depends greatly on the climate scenario which shows future temperature and precipitation change due to global warming, whereas the socio-economic scenario indicating how population, economic activity and technology might change, has a great impact on the projection of water use in the future.
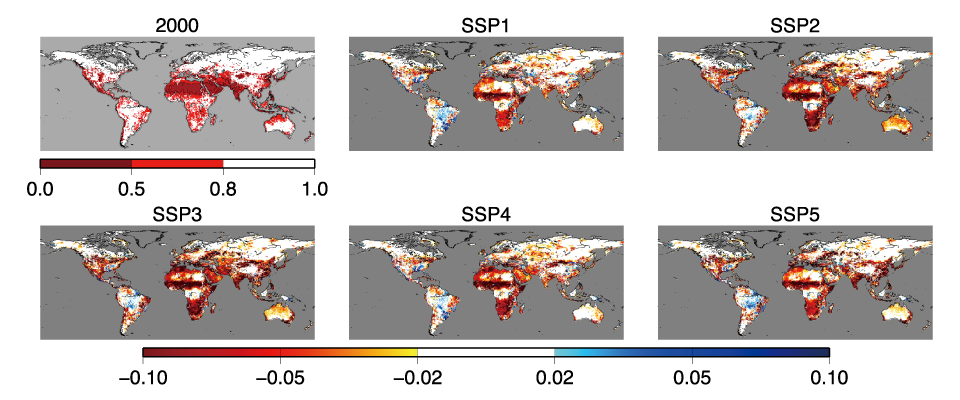
Figure 2 shows the water sufficiency index around 2050 for each of the 5 world views compared to the present. A higher index indicates improved water availability, and a lower index implies more serious water scarcity. The SSP3 (Fragmented world) scenario shows dark red color for a large part of the world including Asia and America, suggesting a more serious water scarcity problem with less available water than necessary in the future compared to the present. On the contrary, in the SSP1 (Sustainable world) scenario almost all areas except Africa are white, which implies that water availability will not change from the present level. The fact that in all scenarios the water sufficiency index for Africa is decreased can be attributed, in addition to global warming impacts, to a drastic increase in water use due to population and economic growth. Among the five scenarios only in SSP1 (Sustainable world) is water availability in the 21st century maintained at the present level except for Africa, while in all the other scenarios water scarcity increases, which points to the necessity to take global actions against global warming and towards the transition to a sustainably society. We are currently conducting research on the effects of adaptation policies.

Figure 1.Scenarios used in the study. (a) Socio-economic scenarios termed SSP1, SSP2, SSP3, SSP4, SSP5 expressing the world views listed in Table 1 with different degrees of mitigation and adaptation possibilities (adapted from O’Neill et al. 2012). (b) Scenarios termed RCP2.6, RCP4.5, RCP6.0, RCP8.5 showing the progress of global warming (adapted from van Vuuren et al. 2011). (c) Combination of socio-economic and global warming scenarios. In cases with no climate policy in place global warming progresses fast, whereas with climate policy implementation global warming can be mitigated even under the same socio-economic scenario (adapted from Hanasaki et al. 2013).

Figure 2.Water sufficiency index. The index, ranging between 0 and 1, shows whether sufficient volume of water is available when it is needed. The upper left pane shows the index in 2000. The darker the red color (low value), the more scarce the water is. The 5 other panes show the 5 socio-economic scenarios with climate policy implementation in 2050 compared to 2000. Red indicates more serious water scarcity problem, blue indicates improved water availability and white indicates unchanged water availability (adapted from Hanasaki et al. 2013). Note: The legends do not indicate interval scales, thus the distances between values are not proportional to the values.
Table 1.Five SSP scenarios and world views
| Scenario | World view |
|---|---|
| SSP1 | Sustainability: Rapid development of low-income countries, reduced inequality, rapid technology development, and high environmental awareness |
| SSP2 | Middle of the Road: Continuation of the current socio-economic trends |
| SSP3 | Fragmentation: Regional blocks, growing population and poverty, slow technical development, environmental degradation, and exploitation of local resources |
| SSP4 | Inequality: High inequality both within and across countries |
| SSP5 | Conventional Development: Economic growth dominated by fossil fuel dependence |
Table 2.Four RCP scenarios showing the progress of global warming
| Scenario | Progress of global warming |
|---|---|
| RCP2.6 | Radiative forcing reaches 2.6 W/m2 by the end of the 21st century* |
| RCP4.5 | Radiative forcing reaches 4.5 W/m2 by the end of the 21st century |
| RCP6.0 | Radiative forcing reaches 6.0 W/m2 by the end of the 21st century |
| RCP8.5 | Radiative forcing reaches 8.5 W/m2 by the end of the 21st century† |
- * In this case, the probability for a global mean temperature rise stabilized at 2℃ is over 66%.
- † This corresponds to the top 10% of the various scenarios published to date, assuming a global warming of the largest scale.


