Seasonal Vertical Synoptic CO2 Variability in the Troposphere
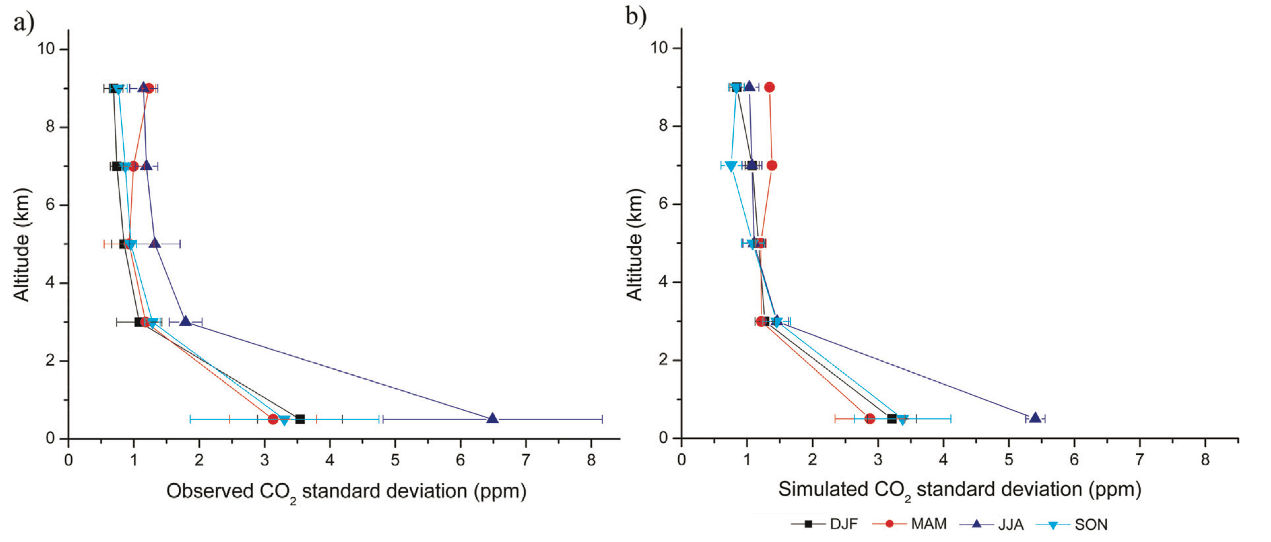
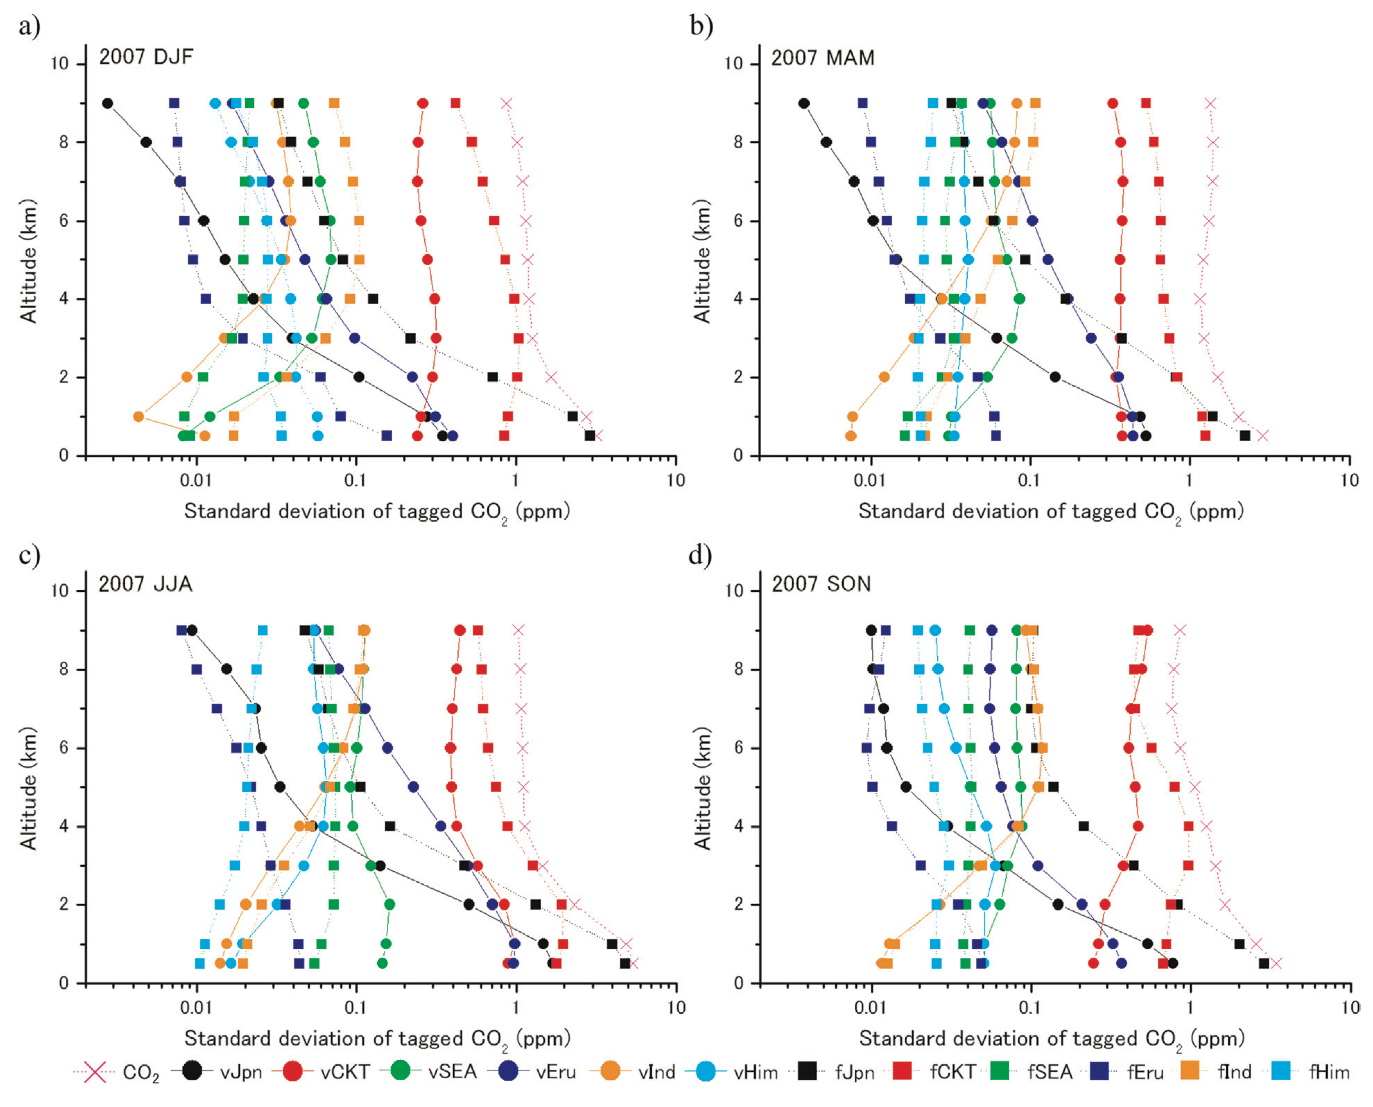
Frequent CO2 measurements obtained by commercial aircraft provide a unique, quasi-continuous record of free-tropospheric CO2 variability. Vertically-resolved synoptic-scale fluctuations of CO2 over Narita International Airport (lat 35.8°N, 140.4°E, 43 m above sea-level) were investigated from November 2005 to March 2009, and combined with analyses of results from a transport model simulation for the year 2007 to retrieve information on sources contributing to the observed variability. The synoptic-scale variability of the observed CO2 mixing ratio, represented by the standard deviation (SD) from the fitted curves, increased in the upper troposphere in the spring, with a noticeable increase at all altitudes in the summer. This seasonal/altitudinal change of the observed SD was shown to be statistically significant throughout the observation period, and the model result agreed with the observation except for the underestimation of the summertime SD. Tagged simulations were conducted to evaluate the relative contribution of the regional fluxes to the synoptic-scale variability over Narita. The results indicate that the major contribution to the free troposphere (FT) variability was made by the fluxes in East Asia, while the Japanese fluxes contributed mostly to the variability in the planetary boundary layer (PBL). A sensitivity analysis was performed to evaluate the relative influence of transport and of flux magnitude on the CO2 SD over Narita for 2007. It was found that a change in the surface flux magnitude could affect the altitudinal distribution of the annual SD over Narita as follows: 41 and 3% at 9 km, 61 and 4% at 5 km, 19 and 83% at 0.5 km when the fossil fuel flux from East Asia and Japan was doubled, respectively. These results are qualitative in nature (since SD is a non-linear function of concentration and flux), but do indicate that the CO2 SD over Narita is more sensitive to the fluctuation in the atmospheric transport (synoptic-scale meteorological variability) in the FT, while showing much more sensitivity to the magnitude of local fluxes in the PBL. The results also point to the fact that vertical profiles of atmospheric CO2 variability at the synoptic scale could potentially provide a useful additional constraint in the inversion analysis of regional CO2 fluxes.
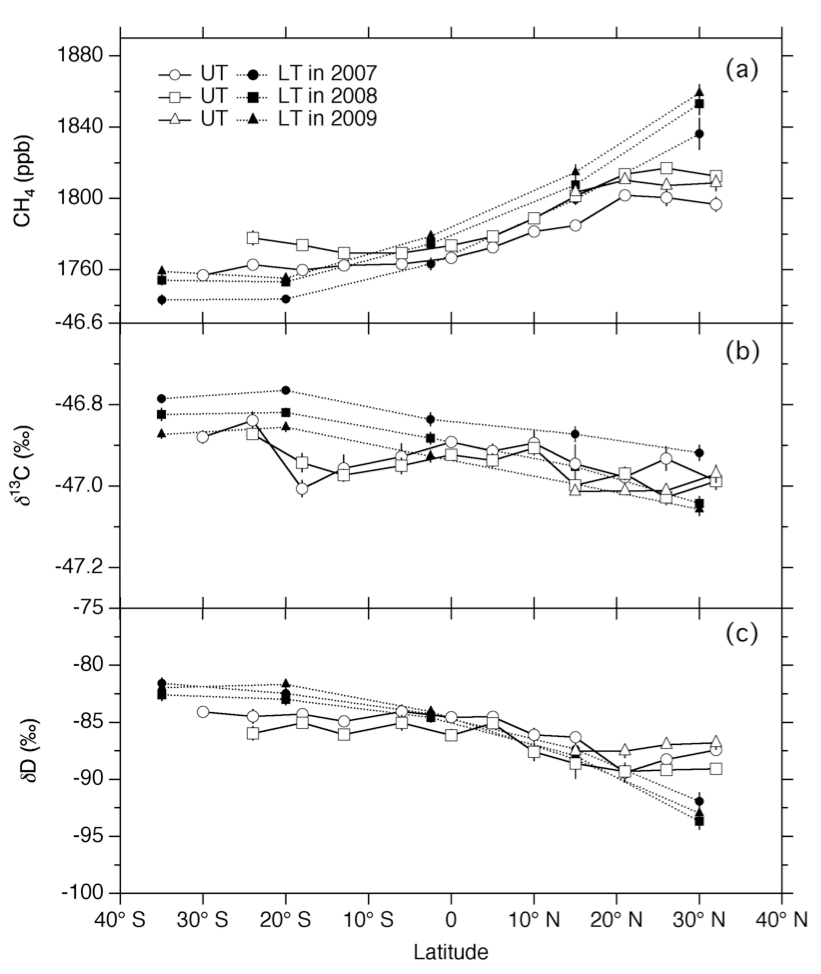
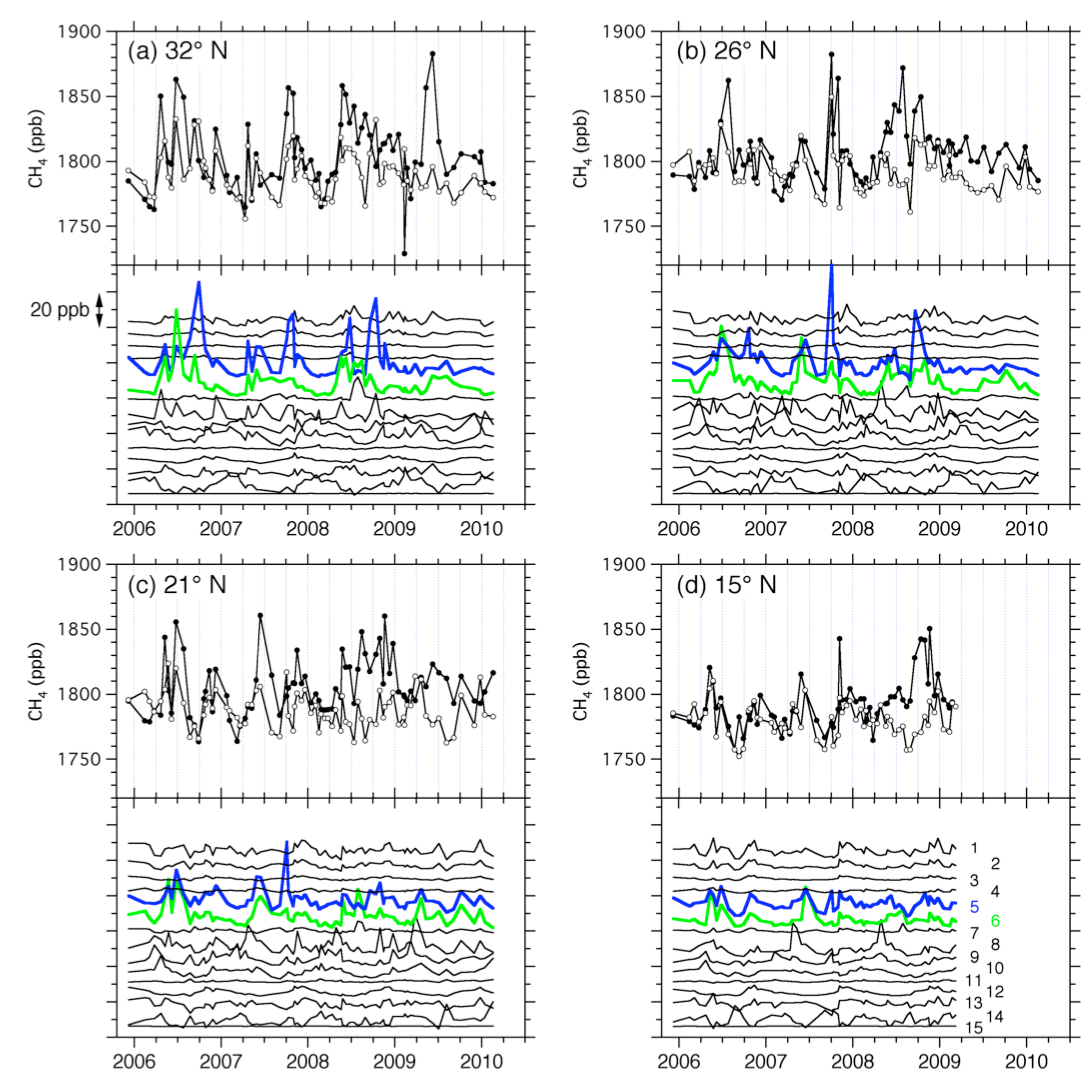
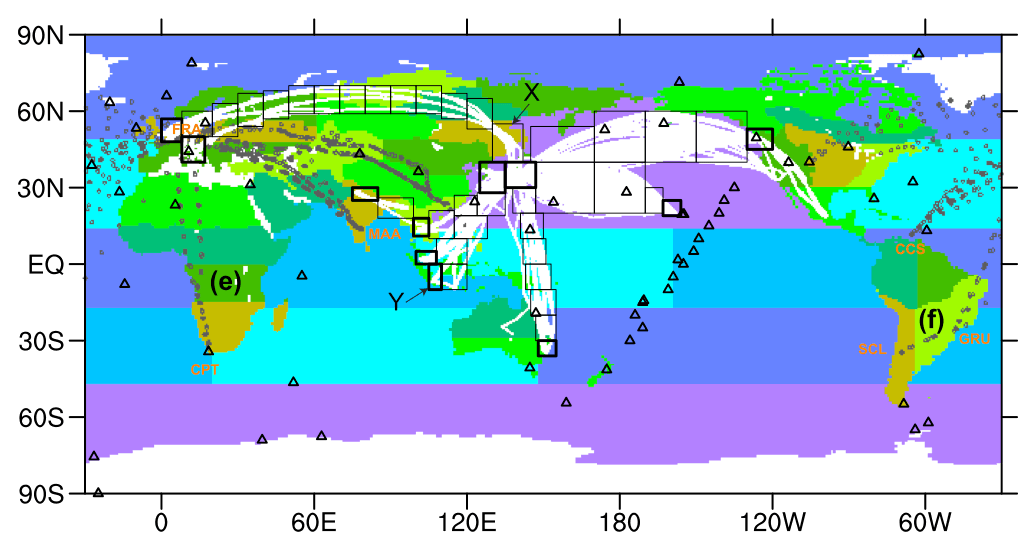
Methane Isotopes in the Troposphere over the Western Pacific
We present the mixing ratio, δ13C and δD of atmospheric CH4 using commercial aircraft in the upper troposphere (UT) over the Western Pacific for the period December 2005–September 2010. The observed results were compared with those obtained using commercial container ships in the lower troposphere (LT) over the same region. In the Northern Hemisphere (NH), the UT CH4 mixing ratio shows high values in the boreal summer–autumn, when the LT CH4 mixing ratio reaches a seasonal minimum. From tagged tracer experiments made using an atmospheric chemistry transport model, we found that such high CH4 values are due to rapid transport of air masses influenced by CH4 sources in South Asia and East Asia. The observed isotopic ratio data imply that these areas have CH4 sources with relatively low δ13C and δD signatures such as biogenic sources. Latitudinal distributions of the annual average UT and LT CH4 mixing ratio intersect each other in the tropics; the mixing ratio value is lower in the UT than in the LT in the NH and the situation is reversed in the Southern Hemisphere (SH), due mainly to the NH air intrusion into the SH through the UT. Such intersection of the latitudinal distributions is observable in δD but not in δ13C, implying an additional contribution from reaction of CH4 with active chlorine in the marine boundary layer. δ13C and δD show low values in the NH and high values in the SH both in the UT and in the LT. We also observed an increase in the CH4 mixing ratio and decreases in δ13C and δD during 2007–2008 in the UT and LT over the Western Pacific, possibly due to enhanced biogenic emissions in the tropics and NH.
JAL Announces Atmospheric-Observation Jet Bearing CONTRAIL Project Logo
Japan Airlines (JAL) will, from July 25, 2012, operate an aircraft bearing the logo of a unique environmental initiative called the CONTRAIL (Comprehensive Observation Network for Trace gases by an Airliner) Project. This aircraft is one of the four 777-200ERs in its fleet installed with equipment for measuring atmospheric carbon dioxide (CO2) and other greenhouse gases (GHGs).
With the addition of the CONTRAIL Project logo to one of the CME-equipped aircraft, and by means of its use on international routes originating from Tokyo (Haneda) to destinations such as Paris, San Francisco and Hong Kong, the organizations aim to raise the worldwide awareness of the goals of this project.
The CONTRAIL Project is funded by the Ministry of the Environment (MOE), Government of Japan, who previously certified JAL as an Eco-First company (http://press.jal.co.jp/en/release/201005/001541.html ). JAL and NIES will continue to work closely as a team with the other three organizations to contribute to the conservation of the global environment through the observation of atmospheric GHGs.


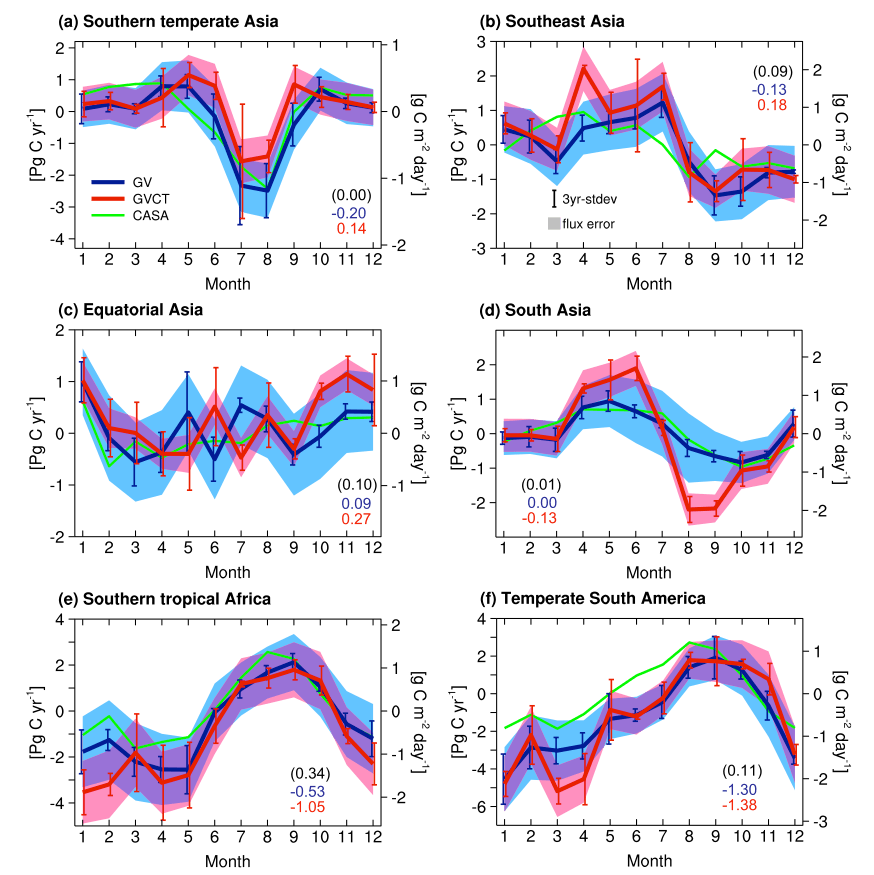
CO2 Inversion: Constraint on Tropical Fluxes
An edited version of this paper was published by AGU. Copyright (2012) American Geophysical Union.
Because very few measurements of atmospheric carbon dioxide (CO2) are available in the tropics, estimates of surface CO2 fluxes in tropical regions are beset with considerable uncertainties. To improve estimates of tropical terrestrial fluxes, atmospheric CO2 inversion was performed using passenger aircraft based measurements of the Comprehensive Observation Network for Trace gases by Airliner (CONTRAIL) project in addition to the surface measurement data set of GLOBALVIEW-CO2. Regional monthly fluxes at the earth’s surface were estimated using the Bayesian synthesis approach focusing on the period 2006-2008 using the Nonhydrostatic Icosahedral Atmospheric Model-based Transport Model (NICAM-TM). By adding the aircraft to the surface data, the posterior flux errors were greatly reduced; specifically, error reductions of up to 64% were found for tropical Asia regions. This strong impact is closely related to efficient vertical transport in the tropics. The optimized surface fluxes using the CONTRAIL data were evaluated by comparing the simulated atmospheric CO2 distributions with independent aircraft measurements of the Civil Aircraft for the Regular Investigation of the atmosphere Based on an Instrument Container (CARIBIC) project. The inversion with the CONTRAIL data yields the global carbon sequestration rates of 2.22 ± 0.28 Pg C yr-1 for the terrestrial biosphere and 2.24 ± 0.27 Pg C yr-1 for the oceans (the both are adjusted by riverine input of CO2). For the first time the CONTRAIL CO2 measurements were used in an inversion system to identify the areas of greatest impact in terms of reducing flux uncertainties.
Observation of Seasonal Transport of CO2
An edited version of this paper was published by AGU. Copyright (2012) American Geophysical Union.
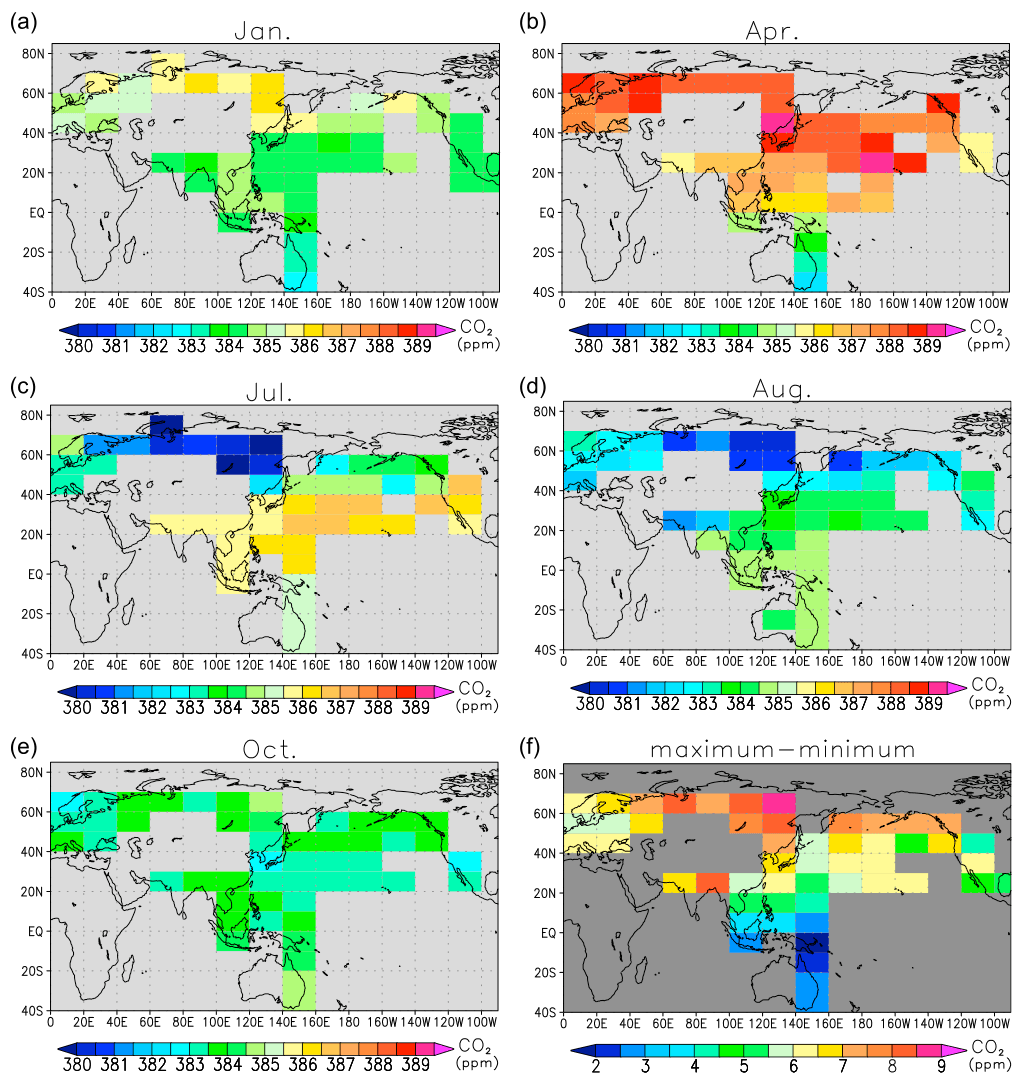
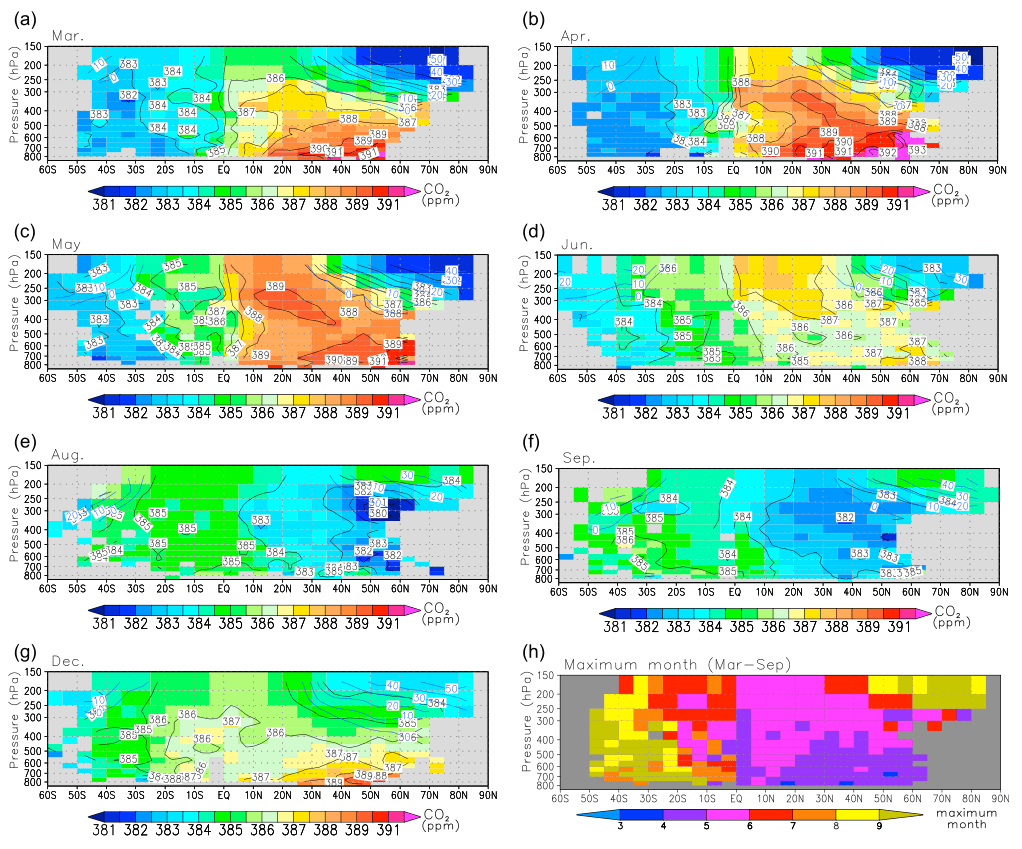
A large number of in situ carbon dioxide (CO2) measurements from 5224 flights were taken by commercial airliners from 2005 to 2010. We analyzed the seasonal cycles in tropospheric CO2 in wide areas of the world over the Eurasian continent, the North Pacific, Southeast Asia, and Oceania. In the Northern Hemisphere, large seasonal changes of CO2 in the upper troposphere are found from spring through summer at northern midlatitudes to high latitudes with significant longitudinal differences; seasonally low CO2 mixing ratios are vertically transported from the surface over the Eurasian continent and then transported eastward to the North Pacific. In the Southern Hemisphere, the CO2 in the upper troposphere increases rapidly from April to June, indicating clearly the interhemispheric transport of high CO2 from the Northern Hemisphere winter. The rapid increase in the upper southern lower latitudes is equivalent to about 0.2 Pg increase in carbon. This interhemispheric transport should be adequately represented in general circulation models for source/sink estimates by inverse methods, because it is comparable to the seasonal or net fluxes estimated for a current inversion area size or a typical subcontinental domain. Estimation for transport of CO2 through the high altitudes will be more important than ever with increasing data from aircraft observations.