
UEDA H.
CGER Reports
CGER'S SUPERCOMPUTER MONOGRAPH REPORT Vol.17
Atmospheric Motion and Air Quality in East Asia
 PDF, 13.6 MB
Chemical transport models (CTMs) and their associated meteorological drivers have advanced our understanding of the atmospheric environment significantly and helped us to clarify processes such as transport, diffusion, chemistry and deposition in the environment. The Asian Center of Air Pollution, ACAP, has made efforts to develop a CTM, and implemented the Model Inter-Comparison Study MICS-Asia II project for interpreting the data of the Acid Deposition Monitoring Network EANET, for clarifying the total picture of atmospheric environment in East Asia, and finally for implementing an effective and sophisticated management of the regional atmospheric environment.
This monograph is an integration of the results of the air motion and air quality in East Asia obtained from meteorological models, CTMs and the findings of the physical processes in the environment.
In the MICS-Asia II project, we compared the model outputs on meteorology parameters, including precipitation, concentration and dry- and wet-deposition of air pollutants (SOx, NOx, sulfate, nitrate and ozone), presented by 9 models. An overview of the findings is presented in Chapter 1. For details, please refer to the Special Issue: MICS-ASIA II of Atmospheric Environment, Volume 41, 2008.
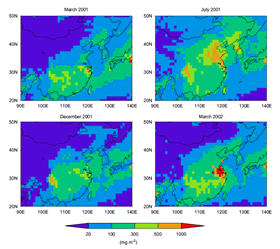
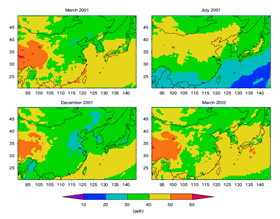
As for the characteristics of air quality in East Asia, yellow sand and volcanic effluents are taken up in Chapters 2 and 3, and the effects of the Tibet plateau, which characterizes the meteorology and air motion in East Asia, are discussed in Chapter 4.Yellow sand, the so-called Kosa, and its deflation, transport and diffusion processes, along with the variation of its size distribution during the long range transport, were well predicted by the CTM. Volcanic effluents such as sulfur oxides were shown to cause environmental acidification. In addition, it was found that sulfuric acid, produced in the volcanic plume, acidifies aerosols to extremely low pH, and gaseous nitric acid and hydrochloric acids, expelled from the aerosols, deposit in large doses and cause secondary environmental acidification. If the pollutant emission continues to increase in the future in East Asia, serious environmental acidification is believed to occur due to both direct and secondary effects. Furthermore, Tibet, the roof of the earth, was shown to create large-scale cyclones in its southeast parts due to earth rotation and density stratification. With this finding, their eastward detachment process from the plateau in the form of migration cyclones could be described theoretically.
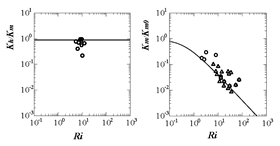
With respect to physical processes, turbulent diffusion is discussed in Chapters 5 and 6 and air-sea interaction is discussed in Chapter 7. To study the atmospheric boundary layer, a model-intercomparison was carried out on the simulated meteorological and air pollution fields and the mechanisms of the diffusion modules were revealed. Next, eddy diffusivities for momentum and for heat and mass were measured directly by MU radar and RASS to investigate the free atmosphere above the boundary layer, i.e., the upper troposphere and lower stratosphere. Their vertical distributions were well reproduced by the stratified turbulence models, especially by our algebraic stress model. In addition, in the free atmosphere, turbulence behavior showed similarity to the mechanism in the surface layer of the atmospheric boundary layer, i.e., the so-called wall turbulence. With regard to the air-sea interaction, the transport mechanism of momentum, heat and mass (water vapor and pollutants) were investigated by a direct numerical simulation DNS. The structures of wavy and turbulent motions were shown to be substantially different, depending on the ratio of the wind wave speed and friction velocity. For the evolution rate of the wind wave the DNS results were found to give a consolidate interpretation of the previous models and empirical formulae.
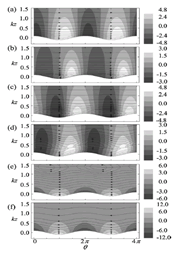
For (a), (b), (c), (d), (e) and (f), c/u∗ = 0, 2, 4, 8, 16 and 20, respectively, where c and u∗ are the wave speed and friction velocity.