Collected Data of High Temporal-Spatial Resolution Marine Biogeochemical Monitoring from Ferry Tracks: Seto Inland Sea (January 1996 to November 1997) and Osaka - Okinawa (January 1996 to March 1998)
 |
This set of CD-ROMs is the third data publication from a marine environmental monitoring program using ferries since 1991. Disks 1 and 2 contain the data from the Seto Inland Sea track by the "Sunflower 2", and the Osaka - Okinawa track by the "Ferry Kuroshio", respectively.
The main contents are the results from continuous sensor measurements (T, S, pH, and fluorescence) on both tracks and from automated filtration sampling (dissolved nutrients, chlorophyll-a, and phaeopigments) on the Seto Inland Sea track. Also included are x-t diagrams to help users browse and visualize the temporal and spatial variations of measured items.
1. Introduction
Anthropogenic perturbations to the cycling of elements such as C, N, P and Si influence marine ecosystems1). This tendency is pronounced in Asian waters
because of the rapid economic growth of the countries bordering them. A monitoring scheme is urgently needed to resolve the temporal-spatial variation in
the sets of nutrient data, phytoplankton properties, and basic physical parameters.
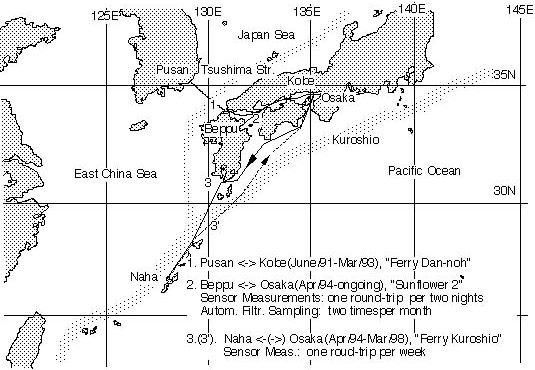
Fig. 1 Ferry tracks used for monitoring. Data products from Line 2 and Line 3(3') are contained in Disk 1 and Disk 2, respectively.
We initiated the first phase of a monitoring program in 1991 by developing a flow-through monitoring system, using the Pusan-Kobe ferry track (Line 1 in Fig. 1). After this ferry service ceased in March 1993, monitoring resumed in April 1994 using the "Sunflower 2" (Line 2) and "Ferry Kuroshio" (Line 3 southbound and Line 3' northbound). Line 3' is located more offshore because the ship takes advantage of the direction of flow of the Kuroshio Current. These two ferries were operated by Kansai Kisen Co., Ltd. and sometimes shifted due to the weather or the optional tours (See APPENDIX.txt). The data produced up to 1995 were published in two CD-ROMs2),3) and some scientific aspects have been described in a monograph4).
In December 1997, "Sunflower 2" was replaced by a new ship, "Sunflower Ivory", and monitoring resumed in February 1998. The "Ferry Kuroshio" service ceased in March 1998 and monitoring of this area will be covered by a container ship that sails further to the southwest.
The present data set contains products from 1996 to the time of replacement of the ships on both lines 2 and 3. An inventory of cruises is listed in
README.txt (See Fig. 2). Details of the method were given in the previous publications2),3),4) and some points are briefly repeated in the following
sections.
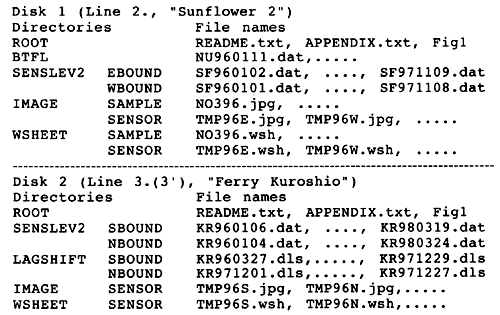
Fig. 2 Directory structure and a typical example of file names. The symbol ..... denotes omitted file names.
2. Methods of Measurement
Automated filtration sampling for dissolved nutrients such as Si(OH)4, PO4, NH4, NO2, NO3 (micro M), chlorophyll-a and phaeopigments (μg l-1), abbreviated
hereafter as DSI, PO4, NH4, NO2, NO3, CHL and PHA, was done at 24 points every other week only on Line 2.
Sensor measurements every 10 seconds were carried out on both lines. Water temperature , salinity (in psu), pH (on the NBS scale), and dissolved oxygen (in mg l-1), hereafter abbreviated as TMP, SAL, PH, DOX, were obtained by Hydrolab H20, an integrated water quality sensor. FLU, the in vivo fluorescence (in μg l-1 of equivalent concentration of fluoresceine solution), was measured by a Turner Design Fluorometer. Measurements were recorded in flash memory together with GPS signals. Retrieval of the data and samples as well as calibration and readjustment of the sensors were done weekly while the ships were at the port of Osaka.
The sensor signals drifted to some extent over the course of each week of continuous flow-through measurements due to the gradual fouling of their seaward-facing surfaces. Therefore, the raw data (Level-1 data, not included in this CD-ROM) were corrected using calibration values determined before and after each weekly measuring period, assuming that the fouling was linear with time, to generate Level-2 data, each numerical file of which corresponds to a one-way cruise. Fig. 3 shows a sample x-t diagram of fluorescence data. For most of the time, the above assumption appeared to be correct. However, as shown in the apparent weekly cycle of relatively high values on days 330 to 360, the sensor drift was not always linear with time. We will calibrate further the fluorescence data, based on chlorophyll-a values from automated filtration sampling, and publish the results as Level-3 data.
We generated two series of values for pH. One series (PH1) was processed using only the calibration value determined before each week of continuous measurements, considering neither temporal drift of the sensor signals nor temperature correction. The other series (PH2) was generated based on calibration values determined before and after each week and assuming a water temperature of 25°.
There was a certain time lag and resultant temperature change while the seawater passed along the pipe from the intake and replaced the volume of water
in the container in which the integrated sensors were soaked. To check them, we attached a sensor for the source water temperature (TMS), which was
available on Line 3(3') during March 1996 to December 1997. We derived the lag number in the record sequence from the TMP and TMS time series for each
cruise using the STATISTICA program. The product of the lag number and the record interval (10 sec) corresponds to the time lag. These are shown in the
cruise inventories. In most cruises, the lag number was around 20. Therefore, the time lag and corresponding distance traveled are around 200 sec and
720 m, respectively. Sometimes, when the performance of the pump declined because of the vessel's pitch and roll, the lag number reached about 50 and
the TMP became higher than TMS by around 1°. Therefore, we generated another data set for Line 3(3') by shifting the data to correspond to the exact
time when the seawater was supposed to be taken from the sea based on the lag number. Users should prefer the time-shifted data in the LAGSHIFT directory
where they exist instead of those in the SENSLEV2 directory (Fig. 2). Fig. 4 illustrates typical relationships among TMP, TMS, FLU(raw) and FLU(shifted).
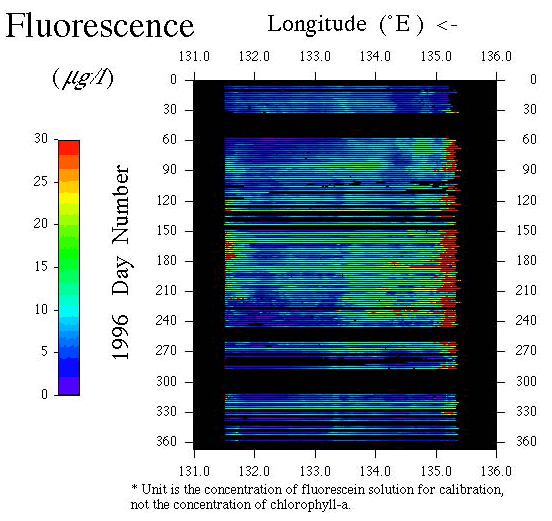
Fig. 3 A sample printout of an x-t diagram from FLU96E.jpg. The file name means fluorescence(FLU), year 1996(96), eastbound cruise(E), and JPEG-format(jpg).
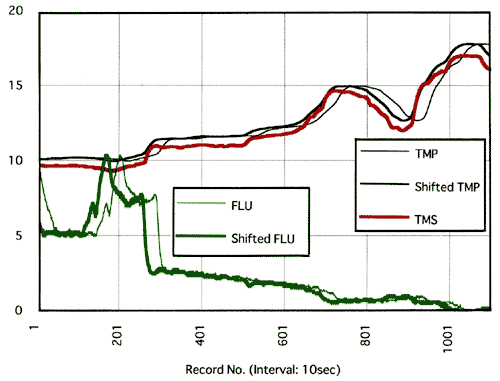
Fig. 4 Relationships among raw temperature values (TMP), water temperature at the source (TMS), raw fluorescence values (FLU), shifted TMP and shifted FLU in a data series on Line 3 ( in the case of KR970206.dat in /KURO/SENSLEV2 and KR970206.dls in /KURO/LAGSHIFT).
3. Method of Data Processing
The CD-ROMs can be mounted on DOS, UNIX, or Macintosh platforms provided with ISO9660 compatible CD-mounters. Disks 1 and 2 contain the products from
Line 2 and Lines 3(3'), respectively (Fig. 2). Macintosh computer users can transform DOS text to Mac-text by changing [CR LF] to [CR] with the Apple
File Exchange utility.
The root directory contains README.TXT and APPENIX.txt. Contents of the fomer is almost identical to this booklet. The latter shows the invectory of the cruises, which is better viewed when imported to a word processor with tab sets at every 1 cm using courier font of 10 points. Fig.1 is also included here.
The SAMPLE directory under the SUNF directory contains DOS text files of the data from automated filtration sampling. The SENSLEV2 directory under both the SUNF and KURO directories contains the sensor measurement data.
Fig. 5(a) shows the structure of record (line) of each bottle and filter datum, which consists of date + time, latitude, longitude, filtered water volume
(ml), dissolved nutrients, CHL and PHA. Fig. 5(b) shows one record line on Line 2, which contains local time, cumulative date from 1900, longitude,
latitude, PH1, SAL, TMP, FLU, DOX, PH2, error flags for the H-20 sensors, fluorometer, and GPS, respectively; the value 0 means no trouble. Fig.5(c)
shows a record from Line 3(3'), in which TMS is added. In the LAGSHIFT directory, the record structure of the file is the same as that in the SENSLEV2
directory except that the measured values are time-shifted based on the derived lag number as shown above. The lag correction for Line 2 has not yet been
completed because of the absence of TMS data. The corrected data sets, Level-3 data, will be made by comparing the results from eastbound and westbound
cruises.
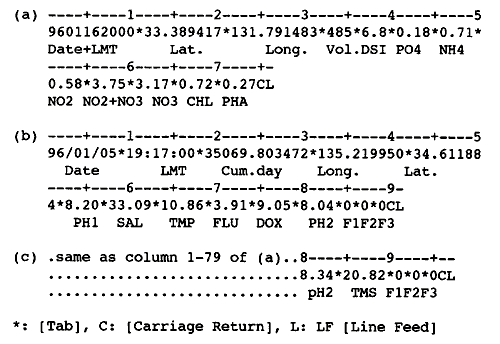
Fig. 5 Data record structure from: (a) automated filtration sampling (in /SUNF/SAMPLE); (b) sensor measurements on Line 2 (in /SUNF/SENSLEV2); and (c) sensor measurements on Line 3(3') (in /KURO/SENSLEV2 and /KURO/LAGSHIFT).
The IMAGE directory contains the JPEG-formatted files of x-t diagrams as exemplified in Fig. 3. The file name, FLU96E.jpg in Fig. 3, is composed of the abbreviated name of the item, the year and direction of the cruise. These x-t diagrams are generated from a text matrixes, which are contained in WSHEET directory. Each value in the matrix averages the data in the time-space element. Its time span represent 1day. The space span is 0.5 minutes of longitude on Line 2 and 0.5 minutes of latitude on Lines 3 and 3', respectively.
4. Acknowledgments
This project owes much of its success to the cooperation of Kansai Kisen Co., Ltd. and the personnel/organizations listed below. Financial support is
from the Global Environment Research Fund of the Japan Environment Agency (Grant No. D3(1)), as well as the Global Environmental Monitoring Budget of
NIES-CGER.
Committee for East Asian Marine Environmental Monitoring Using Ships-of-Opportunity:
Y. Fukuyo (14), K. Furuya (14), A. Harashima (1, 11), K. Kohata (11), Y. Nojiri (1, 11), K. Ohta (10), K. Takano (#), H. Takeoka (2), Y. Tanaka (7, 13),
the late R. Tsuda (7, Chief).
Secretariat Office:
Y. Fujinuma (1), H. Endoh (1), T. Anzai (1)
Monitoring Execution Team:
A. Harashima (Chief), T. Hagiwara (3), H. Kimoto (6), E. Ohta (4), T. Toshiyasu (4), T. Wakabayashi (4)
Advisory members:
H.-D. Ahn (8), K. Imao (9), K. Furusawa (9), H. Iida (5), M. Kunugi (11), Y., Nakamura (11), J.-R. Oh (8), T. Ueno (5)
CD-ROM Preparation Team
A. Harashima1 (1,11), Y. Satoh (11), K. Nunoi (1)
Participating Organizations
(1) NIES-CGER; (2) Ehime University; (3) Global Environmental Forum; (4) Japan Weather Association; (5) Kansai Kisen Co., Ltd.; (6) Kimoto Electric Co., Ltd.; (7) Kinki University; (8) Korea Ocean Research and Development Institute; (9) Marine Biological Research Institute of Japan Co., Ltd.; (10) Nagoya University; (11) NIES; (12) Research Institute of Oceano-Chemistry; (13) Tokyo University of Fisheries; (14) University of Tokyo; (#) Professor Emeritus, University of Tsukuba.
References
1) Jickells, T. D. (1998) Nutrient Biogeochemistry of the Coastal Zone, Science, 28, 1217-1222.
2) Harashima, A. (ed.) (1995): Collected data of high temporal-spatial resolution marine biogeochemical monitoring by Japan-Korea ferry boat -June 1991
- February 1993 -, CGER-D007(CD-ROM)-'95.
3) Harashima, A. (ed.) (1997): Collected data of high temporal-spatial resolution marine biogeochemical monitoring by ferries in the Asian Marginal Sea
- 1994-1995 -, CGER-D0012(CD-ROM)-'97.
4) Harashima, A., Tsuda, R., Tanaka, Y., Kimoto, T., Furusawa, K. and Tatsuta, H. (1997): Monitoring algal blooms and related biogeochemical changes in the
adjacent seas of Japan by a flow-through system deployed on a ferry, in Kahru, M. et al. (eds.) Monitoring Algal Blooms: New Techniques for Detecting
Large-Scale Environmental Change, pp.84-112, Springer, Berlin.